xpertsystems/enr007-sample
收藏资源简介:
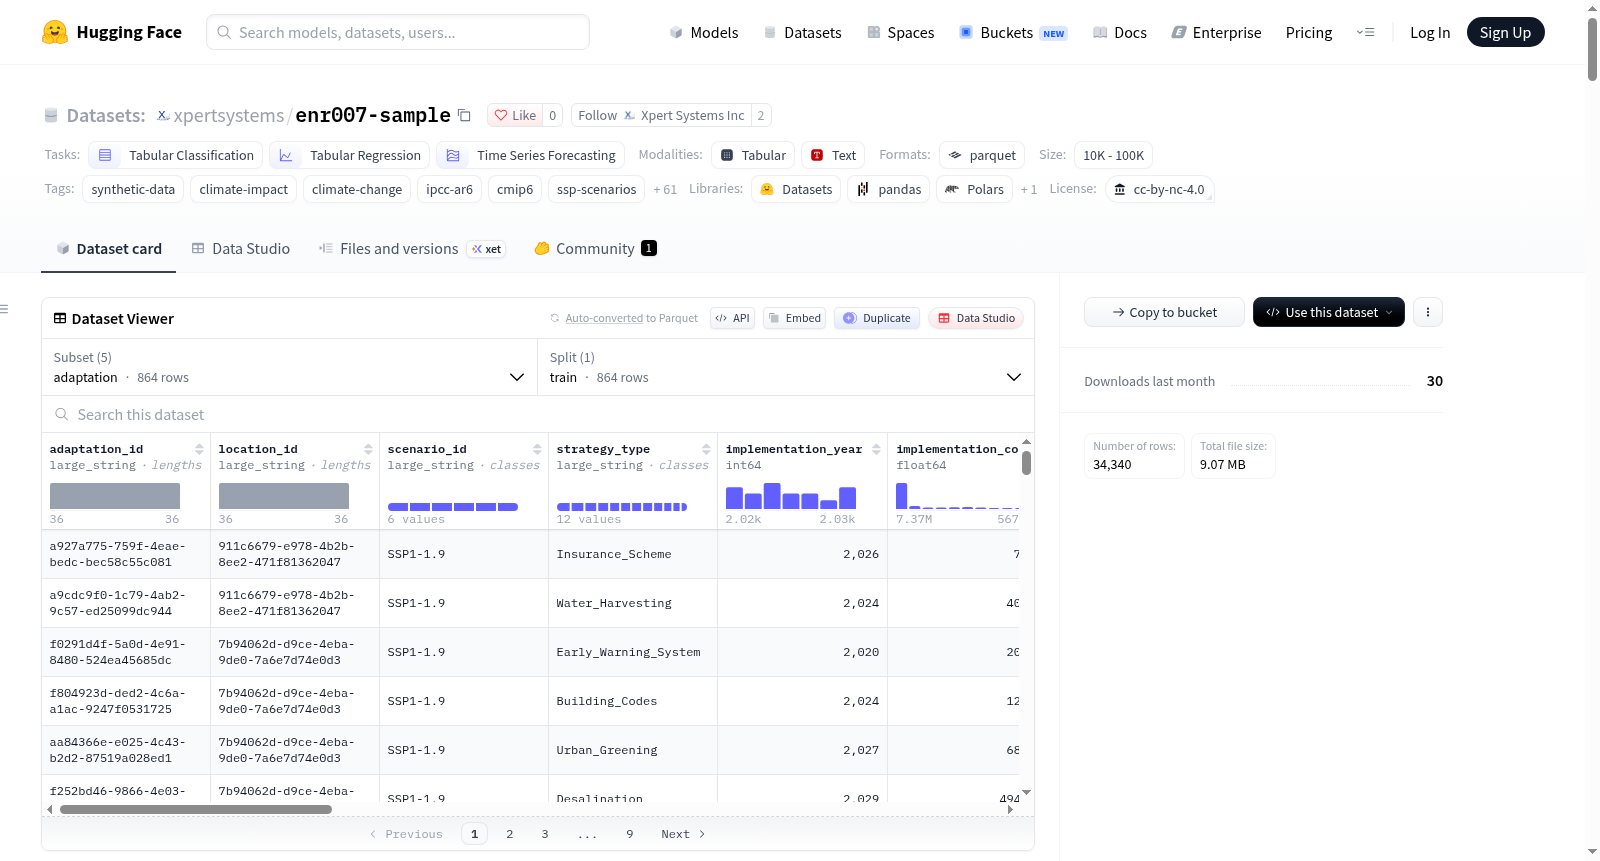
--- license: cc-by-nc-4.0 task_categories: - tabular-classification - tabular-regression - time-series-forecasting tags: - synthetic-data - climate-impact - climate-change - ipcc-ar6 - cmip6 - ssp-scenarios - ssp1-1-9 - ssp1-2-6 - ssp2-4-5 - ssp3-7-0 - ssp5-8-5 - climate-projections - temperature-projections - global-mean-surface-temperature - gmst - polar-amplification - enso - pdo - natural-variability - ensemble-spread - extreme-events - heatwave - flood - drought - wildfire - hurricane - compound-events - climate-attribution - fischer-knutti - carbon-emissions - ghg-protocol - scope-1-2-3 - co2 - methane - ch4 - n2o - hfcs - gwp-100 - carbon-budget - net-zero - ngfs - ngfs-scenarios - carbon-pricing - carbon-dioxide-removal - cdr - sea-level-rise - slr - thermal-expansion - ice-sheet - glacier - ocean-acidification - ocean-ph - marine-heatwave - storm-surge - adaptation - maladaptation - benefit-cost-ratio - undrr - world-bank - climate-finance - physical-climate-risk - transition-risk - tcfd - sasb - noaa-storm-events - munich-re-natcat - iea-ghg pretty_name: ENR007 — Synthetic Climate Impact Dataset (Sample) size_categories: - 10K<n<100K configs: - config_name: temperature data_files: ENR007_climate_all.parquet - config_name: extreme_events data_files: ENR007_extreme_events_all.parquet - config_name: emissions data_files: ENR007_emissions_all.parquet - config_name: sea_level data_files: ENR007_sea_level_all.parquet - config_name: adaptation data_files: ENR007_adaptation_all.parquet --- # ENR007 — Synthetic Climate Impact Dataset (Sample Preview) **XpertSystems.ai | Synthetic Data Factory | Energy & Climate Vertical** A **five-table climate impact dataset** spanning the full physical & transition risk surface: temperature projections with polar amplification and ENSO-like natural variability, extreme weather events (12 hazard types with climate attribution fractions), carbon emissions pathways (6 sectors × 4 GHG species with carbon budgets and pricing), sea level rise (GMSL decomposition into thermal expansion + ice sheets + glaciers, ocean pH, marine heatwaves), and adaptation strategies (12 strategy types with BCR, NPV, maladaptation flags). Calibrated benchmark-first against **IPCC AR6 (2021) WG1 Tables SPM.1 and 9.9**, **CMIP6 model ensemble**, **NOAA Storm Events**, **Munich Re NatCat**, **IEA GHG (2022)**, **Fischer & Knutti (2015) attribution meta-analysis**, **NGFS scenarios**, and **UNDRR/World Bank adaptation literature**. **All six IPCC SSP scenarios are included in the sample** (SSP1-1.9, SSP1-2.6, SSP2-4.5, SSP3-7.0, SSP5-8.5, Current Policy) — the SSP comparison is the dataset's signature feature. This is the **sample preview** — 30 locations × 30 years (2020-2049) × all 6 SSP scenarios (~34K total records). The full product covers 500-1000+ locations × 80 years (full IPCC AR6 century horizon to 2100) × all 6 SSP scenarios (~10M+ records) with full geographic detail and complete adaptation strategy coverage. --- ## Dataset summary | Table | Rows (sample) | What it contains | |---|---:|---| | `temperature` | 5,400 | Per location × year × scenario climate projections: GMST anomaly, regional anomaly (with polar amplification), ensemble p10/mean/p90 spread, ENSO-like natural variability, heat index, frost days, growing degree days, Tmax record exceedance, UHI offset | | `extreme_events` | ~22,000 | 12 hazard types (Heatwave, Cold_Snap, Flood, Flash_Flood, Drought, Wildfire, Hurricane, Tornado, Blizzard, Ice_Storm, Storm_Surge, Compound_Event) with severity (Moderate / Severe / Extreme / Exceptional), return period & AEP, damage USD (Pareto tail), insured loss, fatalities, displaced persons, climate attribution fraction, frequency change | | `emissions` | 4,320 | 6 sectors (Energy, Transport, Industry, Agriculture, LULUCF, Waste) × 4 gases (CO2, CH4, N2O, HFCs) × years × 6 scenarios. Includes Scope 1/2/3 decomposition, carbon budgets remaining (1.5°C and 2°C), CDR deployment, per-capita CO2, carbon price trajectories | | `sea_level` | 1,800 | Coastal locations × year × scenario: GMSL with three-part decomposition (thermal expansion + ice sheet + glacier), regional SLR with vertical land motion, ocean pH, marine heatwave days, ocean heat content, storm surge, coastal flood frequency change | | `adaptation` | 864 | 12 adaptation strategy types per location: BCR, NPV of avoided damages, implementation cost & timeline, damage reduction, effectiveness score, maladaptation risk flag, equity score, CO2 mitigation co-benefit (for nature-based solutions) | All five tables are provided in both **CSV** and **Parquet**. They join on `location_id`, `scenario_id`, and `year`. --- ## Calibration sources All ten validation metrics target named industry / scientific sources: - **IPCC AR6 (2021) WG1 Table SPM.1** — SSP temperature trajectories (2050 + 2100 medians, p10, p90) - **IPCC AR6 (2021) WG1 Chapter 4** — ensemble spread and climate indices (frost days, growing degree days under warming) - **IPCC AR6 (2021) WG1 Chapter 5** — ocean acidification trajectories (pH drop by SSP scenario) - **IPCC AR6 (2021) WG1 Chapter 9 Table 9.9** — sea level rise projections - **IPCC AR6 (2021) WG1 Chapter 11** — extreme event attribution - **CMIP6 multi-model ensemble** — temperature spread and natural variability - **NOAA Storm Events Database** — extreme event frequencies and damages - **Munich Re NatCat / Swiss Re sigma** — insured loss fractions, damage distributions - **Fischer & Knutti (2015)** — climate attribution meta-analysis (event frequency sensitivity to warming) - **IEA GHG (2022)** — sector-level emissions baselines and decline rates - **GHG Protocol Corporate Standard** — Scope 1/2/3 emissions decomposition - **NGFS Climate Scenarios** — carbon price trajectories by SSP - **UNDRR Global Assessment Report + Schipper (2020)** — maladaptation risk under deep warming - **World Bank / UNDRR** — adaptation cost-benefit literature --- ## Validation scorecard (seed = 42) 10/10 PASS · **Grade A+ (100%)** across all six canonical seeds (42, 7, 123, 2024, 99, 1). | # | Metric | Observed | Target | Tol | Type | Source | |---|---|---:|---:|---:|---|---| | 1 | `ensemble_p10_le_mean_le_p90_rate` | 1.000 | 0.99 | ±0.01 | FLOOR | IPCC AR6 WG1 Ch 4 | | 2 | `aep_equals_inverse_return_period_rate` | 0.979 | 0.95 | ±0.05 | FLOOR | Probability theory | | 3 | `scope_sum_equals_annual_emissions_rate` | 1.000 | 0.99 | ±0.01 | FLOOR | GHG Protocol | | 4 | `insured_loss_le_economic_damage_rate` | 1.000 | 0.99 | ±0.01 | FLOOR | Munich Re NatCat | | 5 | `climate_attribution_fraction_in_bounds_rate` | 1.000 | 0.99 | ±0.01 | FLOOR | IPCC AR6 Ch 11 / Fischer & Knutti | | 6 | `carbon_price_2030_matches_scenario_targets_rate` | 1.000 | 0.99 | ±0.01 | FLOOR | NGFS / IPCC AR6 | | 7 | `ocean_ph_in_ar6_band_rate` | 1.000 | 0.99 | ±0.01 | FLOOR | IPCC AR6 WG1 Ch 5 | | 8 | `frost_days_decrease_with_warming` | 1.000 | 1.00 | ±0.01 | FLOOR | IPCC AR6 WG1 Ch 4 | | 9 | `gmsl_warming_ordering` | 1.000 | 1.00 | ±0.01 | FLOOR | IPCC AR6 WG1 Ch 9 Table 9.9 | | 10 | `maladaptation_warming_ordering` | 1.000 | 1.00 | ±0.01 | FLOOR | UNDRR GAR / Schipper (2020) | The **AR6 scenario warming ordering test** (#9) confirms that GMSL at the terminal year (2049 in this sample) is properly ordered across SSPs: SSP5-8.5 > SSP3-7.0 > Current_Policy > SSP2-4.5 > SSP1-2.6 > SSP1-1.9. --- ## Schema highlights ### `temperature` (5,400 rows × 21 cols, all 6 scenarios) `location_id`, `scenario_id` (SSP1-1.9 / SSP1-2.6 / SSP2-4.5 / SSP3-7.0 / SSP5-8.5 / Current_Policy), `year`, `global_mean_temp_anomaly_C`, `regional_temp_anomaly_C`, `ensemble_mean_C`, `ensemble_p10_C`, `ensemble_p90_C`, `temp_trend_C_per_decade`, `natural_variability_C`, `heat_index_C`, `frost_days_per_year`, `growing_degree_days`, `tmax_record_exceedance_flag`, `urban_heat_island_C`, `latitude`, `longitude`, `region_type` (Polar / Temperate / Mediterranean / Tropical / Arid / Coastal / Island / Mountainous), `is_coastal`, `is_urban`. ### `extreme_events` (~22,000 rows × 22 cols) `event_id`, `location_id`, `scenario_id`, `year`, `event_type` (12 hazards), `event_severity` (Moderate / Severe / Extreme / Exceptional), `event_start_date`, `event_end_date`, `duration_days`, `affected_area_km2`, `peak_intensity`, `return_period_years`, `annual_exceedance_prob`, `economic_damage_USD`, `insured_loss_USD`, `fatalities`, `displaced_persons`, `infrastructure_damage_score`, `compound_event_flag`, `climate_attribution_fraction`, `event_frequency_change_pct`, `latitude`, `longitude`, `region_type`. ### `emissions` (4,320 rows × 19 cols) `scenario_id`, `year`, `emission_sector` (Energy / Transport / Industry / Agriculture / LULUCF / Waste), `gas_type` (CO2 / CH4 / N2O / HFCs), `gwp_100yr`, `annual_emissions_MtCO2e`, `cumulative_emissions_GtCO2`, `carbon_budget_remaining_1_5C_GtCO2`, `carbon_budget_remaining_2C_GtCO2`, `emission_intensity_kgCO2_per_GDP`, `per_capita_tCO2e`, `fossil_fuel_combustion_pct`, `land_use_change_MtCO2`, `cdr_deployment_MtCO2yr`, `net_zero_year`, `scope1_emissions_MtCO2e`, `scope2_emissions_MtCO2e`, `scope3_emissions_MtCO2e`, `carbon_price_USD_per_tCO2`, `stranded_asset_risk_USD_B`. ### `sea_level` (1,800 rows × 17 cols) `location_id`, `scenario_id`, `year`, `global_mean_sea_level_rise_mm`, `regional_slr_mm`, `slr_likely_range_low_mm`, `slr_likely_range_high_mm`, `thermal_expansion_mm`, `ice_sheet_contribution_mm`, `glacier_contribution_mm`, `vertical_land_motion_mm_yr`, `coastal_flood_frequency_change_pct`, `storm_surge_height_m`, `ocean_ph`, `ocean_heat_content_ZJ`, `marine_heatwave_days_per_yr`, `latitude`, `longitude`, `region_type`, `is_coastal`. ### `adaptation` (864 rows × 15 cols) `adaptation_id`, `location_id`, `scenario_id`, `strategy_type` (Seawall / Managed_Retreat / Urban_Greening / Crop_Diversification / Early_Warning_System / Building_Codes / Water_Harvesting / Reforestation / Insurance_Scheme / Social_Safety_Net / Desalination / Wetland_Restoration), `implementation_year`, `implementation_cost_USD`, `annual_maintenance_cost_USD`, `benefit_cost_ratio`, `damage_reduction_pct`, `co2_mitigation_potential_MtCO2yr`, `adaptation_effectiveness_score`, `maladaptation_risk_flag`, `equity_score`, `implementation_timeline_years`, `avoided_damages_USD_NPV`, `region_type`, `is_coastal`, `latitude`. --- ## Suggested use cases - **SSP scenario comparison ML** — train classifiers / regressors that predict regional climate outcomes given an input SSP scenario; benchmark prediction skill across the 6 SSP trajectories - **Climate attribution ML** — train classifiers for `climate_attribution_fraction` from event_type, severity, location, scenario; useful for litigation / regulatory ML pipelines - **Extreme event return period estimation** — fit Generalized Extreme Value (GEV) models per event_type × region_type and benchmark against the included `return_period_years` - **Catastrophe (CAT) modeling pipelines** — combine `economic_damage_USD`, `insured_loss_USD`, `fatalities`, `affected_area_km2` features for Pareto-tail loss models à la Munich Re / Swiss Re - **Carbon budget exhaustion forecasting** — predict `carbon_budget_remaining_1_5C_GtCO2` trajectories under different policy paths; useful for transition-risk ML for TCFD/SASB - **Scope 1/2/3 emissions decomposition** — train sector-level disaggregation models for corporate emissions reporting - **Net Zero pathway optimization** — model `cdr_deployment_MtCO2yr` and `carbon_price_USD_per_tCO2` joint dynamics for IAM (integrated assessment model) augmentation - **Coastal SLR risk ML** — predict regional SLR from GMSL drivers (thermal_expansion / ice_sheet / glacier components) + vertical land motion; useful for asset-level coastal risk scoring - **Ocean acidification trajectory modeling** — fit pH decay models per scenario for marine ecosystem ML - **Storm surge × SLR compound risk** — model `storm_surge_height_m` as function of baseline surge + regional_slr_mm for flood ML - **Adaptation strategy selection ML** — train recommenders for cost-effective adaptation portfolios given location, scenario, and budget constraints; benchmark BCR and `damage_reduction_pct` - **Maladaptation risk classification** — supervised learning on `maladaptation_risk_flag` from strategy_type, scenario, location - **Climate-economy coupled modeling** — join emissions + adaptation + extreme events for integrated assessment ML pipelines - **Physical climate risk for portfolio analysis** — aggregate location-level extreme event damages + SLR exposure to asset/portfolio level for TCFD physical risk disclosure - **Net-zero year prediction** — classifier for `net_zero_year` given sector decline rates and CDR deployment trajectories --- ## Loading examples ```python from datasets import load_dataset temp = load_dataset("xpertsystems/enr007-sample", "temperature", split="train") events = load_dataset("xpertsystems/enr007-sample", "extreme_events", split="train") print(temp.shape, events.shape) ``` ```python import pandas as pd from huggingface_hub import hf_hub_download # Compare SSP scenario warming trajectories temp = pd.read_parquet(hf_hub_download( "xpertsystems/enr007-sample", "ENR007_climate_all.parquet", repo_type="dataset", )) # Mean GMST anomaly by year and scenario trajectory = ( temp.groupby(["scenario_id", "year"])["global_mean_temp_anomaly_C"] .mean() .unstack(level="scenario_id") .round(3) ) print(trajectory.tail(10)) # last 10 years ``` ```python # Extreme event damages by scenario import pandas as pd from huggingface_hub import hf_hub_download events = pd.read_parquet(hf_hub_download( "xpertsystems/enr007-sample", "ENR007_extreme_events_all.parquet", repo_type="dataset", )) # Total damages by SSP scenario damages = ( events.groupby("scenario_id") .agg( total_damage_billion_USD=("economic_damage_USD", lambda x: x.sum() / 1e9), total_fatalities=("fatalities", "sum"), n_events=("event_id", "count"), ) .round(2) .sort_values("total_damage_billion_USD", ascending=False) ) print(damages) ``` ```python # Carbon budget trajectories import pandas as pd from huggingface_hub import hf_hub_download emis = pd.read_parquet(hf_hub_download( "xpertsystems/enr007-sample", "ENR007_emissions_all.parquet", repo_type="dataset", )) # 1.5°C budget remaining by year, per scenario (CO2-only) budget_traj = ( emis[emis["gas_type"] == "CO2"] .groupby(["scenario_id", "year"])["carbon_budget_remaining_1_5C_GtCO2"] .mean() .unstack(level="scenario_id") .round(1) ) print(budget_traj.tail(10)) ``` ```python # Sea level rise decomposition import pandas as pd from huggingface_hub import hf_hub_download slr = pd.read_parquet(hf_hub_download( "xpertsystems/enr007-sample", "ENR007_sea_level_all.parquet", repo_type="dataset", )) # Component contributions at terminal year terminal = slr[slr["year"] == slr["year"].max()] print(terminal.groupby("scenario_id").agg( gmsl_mm=("global_mean_sea_level_rise_mm", "mean"), thermal_mm=("thermal_expansion_mm", "mean"), ice_sheet_mm=("ice_sheet_contribution_mm", "mean"), glacier_mm=("glacier_contribution_mm", "mean"), ).round(1)) ``` --- ## Limitations and honest disclosures This sample is calibrated for **structural fidelity, not bit-exact reproduction of any specific CMIP6 model run.** Specifically: - **Sample covers 30 years (2020-2049), not the full IPCC AR6 century** to 2100. SSP scenario divergence is most pronounced at 2080-2100; this sample shows early-divergence behavior. The full product extends to 2100. Per-scenario benchmarks for 2100 (from `SCENARIOS` dict in the generator) cannot be directly tested at this horizon. - **Climate scenarios use prescribed 2050+2100 median benchmarks** with quadratic interpolation between (line 217-219 of generator). The shape of the trajectory between 2050 and 2100 is a simple quadratic, not an actual coupled climate-carbon cycle simulation. For coupled-system research, use CMIP6 model output directly. - **Polar amplification is a single scalar per region_type** (line 188). Real polar amplification varies with season, depth (ocean), and feedback processes that this synthetic dataset does not model. - **ENSO/PDO natural variability is a single AR(1) process** with φ=0.72 (line 222). Real ENSO is non-Gaussian, has multi-decadal regime shifts, and interacts with PDO/AMO. Use as a low-fidelity natural-variability proxy. - **Extreme event damages use Pareto tail with shape per event_type** (line 339). Compound and tail-risk dependence (e.g., heatwave conditional on drought) is not modeled beyond the single `Compound_Event` category. - **`annual_emissions_MtCO2e` for non-CO2 gases is in native Mt of the gas, not Mt CO2-equivalent.** The generator splits emissions by gas via fixed fractions (0.75/0.17/0.06/0.02 for CO2/CH4/N2O/HFCs) and applies the sector decline rate. The reported value is gas-mass, not CO2e. The `gwp_100yr` column is provided for user-side conversion: CO2e = value × gwp. Don't compare raw `annual_emissions_MtCO2e` totals across gases without that multiplication. - **`cumulative_emissions_GtCO2` accumulates CO2 only** (not CO2e of other gases). Matches AR6 budget convention but means the cumulative total is not all-GHG. The `carbon_budget_remaining_*` columns are CO2-only-budget-compatible. - **`location_id`s do not match between scenarios.** Each scenario run generates a fresh location pool via `generate_locations(seed)`. Same seed → same locations across scenarios. Different seed → fresh locations. When comparing scenarios, group by (scenario_id, year) with aggregation, not on per-location panel. - **Sea level coverage**: at sample scale, locations marked as `is_coastal=True` get full SLR records. The generator falls back to `locations.iloc[:max(1, len/3)]` if no coastal locations exist; at n=30 typically 10-15 coastal locations arise naturally. - **`vertical_land_motion_mm_yr`** is sampled once per location and applied as `vlm * (yr - 2020)` (line 503). Real VLM has spatial correlation (subsidence basins) and can be non-linear over decades. - **Adaptation strategies are independent draws per location** — no portfolio-level interactions or stacking benefits. Real adaptation often shows complementarity (e.g., Seawall + Wetland_Restoration combined is more effective than either alone). - **`benefit_cost_ratio` and `bcr_mu` are scenario-warming-scaled** (line 576-578): higher warming → higher BCR (because there's more damage to avoid). Realistic but should not be interpreted as cost-effectiveness in a vacuum. - **`net_zero_year` is hardcoded per scenario** in the SCENARIOS dict (SSP1-1.9: 2050, SSP1-2.6: 2065, SSP2-4.5: 2095, others: None for scenarios that never reach net zero). Sample data may not visibly show net zero achievement since horizon ends at 2049. - **Carbon price 2030 EXACTLY matches** the scenario target by design (deterministic interpolation in the generator). Real policy paths show stochastic deviations from target prices. The full ENR007 product addresses these by full 2100 horizon, expanded location-pool location consistency across scenarios, multi-model CMIP6 ensemble draws, compound-event tail dependence modeling, and detailed adaptation portfolio interactions — contact us for the licensed commercial release. --- ## Companion datasets in the Energy & Climate vertical - **ENR-001** — Synthetic Power Grid Operations Dataset (transmission bus telemetry, line flows, dispatch, frequency, contingency) - **ENR-002** — Synthetic Renewable Energy Generation Dataset (utility-scale solar/wind/hybrid SCADA, weather, forecast, PCC, BESS) - **ENR-003** — Synthetic Electricity Demand & Load Forecasting Dataset (zone-level demand, multi-horizon forecasts, peak events, EV/DER, TOU) - **ENR-004** — Synthetic Upstream Oil & Gas Production Dataset (well-level production, decline curves, PVT, commodity prices, Subpart W methane) - **ENR-005** — Synthetic Smart Grid Dataset (AMI, DER, OpenADR, feeder power flow, grid edge analytics) - **ENR-006** — Synthetic Wholesale Energy Market Trading Dataset (spot prices, futures, ancillary services, bilateral PPAs, trading risk) - **ENR-007** — Synthetic Climate Impact Dataset (you are here) — **the forward-looking climate forcing companion** to the rest of the Energy & Climate vertical: IPCC SSP scenario inputs that feed emissions intensity (ENR-004), renewable resource trends (ENR-002), demand load patterns (ENR-003), and grid stress events (ENR-001). Use **ENR-004 + ENR-007** together for transition-risk + physical-risk ML on fossil supply chains; combine with **ENR-001 + ENR-002 + ENR-003** for end-to-end climate impact on physical grid + renewables + demand. For subsurface companion data (seismic, well logs, reservoir simulation, geological formations), see the **OIL series** (OIL-001 through OIL-004) in our [Oil & Gas vertical](https://huggingface.co/xpertsystems). For the broader catalog: - [Materials & Energy](https://huggingface.co/xpertsystems) — MAT-001 - [Insurance & Risk](https://huggingface.co/xpertsystems) — 10 SKUs - [Cybersecurity](https://huggingface.co/xpertsystems) — 11 SKUs --- ## Citation ```bibtex @dataset{xpertsystems_enr007_sample_2026, author = {XpertSystems.ai}, title = {ENR007 Synthetic Climate Impact Dataset (Sample Preview)}, year = 2026, publisher = {Hugging Face}, url = {https://huggingface.co/datasets/xpertsystems/enr007-sample} } ``` --- ## Contact - **Web:** https://xpertsystems.ai - **Email:** pradeep@xpertsystems.ai - **Full product catalog:** Cybersecurity, Insurance & Risk, Materials & Energy, Oil & Gas, Energy & Climate, and more **Sample License:** CC-BY-NC-4.0 (Creative Commons Attribution-NonCommercial 4.0) **Full product License:** Commercial — please contact for pricing.
ENR007 is a synthetic climate impact dataset (sample preview) consisting of five tables that span the full physical and transition risk surface. It includes temperature projections with polar amplification and ENSO-like natural variability, extreme weather events (12 hazard types with climate attribution fractions), carbon emissions pathways (6 sectors × 4 GHG species with carbon budgets and pricing), sea level rise (decomposition of global mean sea level rise into thermal expansion, ice sheet, and glacier contributions, along with ocean pH and marine heatwaves), and adaptation strategies (12 strategy types with benefit-cost ratio, net present value, and maladaptation flags). The dataset is calibrated against authoritative sources such as IPCC AR6, CMIP6 model ensemble, NOAA Storm Events Database, Munich Re NatCat, IEA GHG, and others. The sample includes all six IPCC SSP scenarios (SSP1-1.9, SSP1-2.6, SSP2-4.5, SSP3-7.0, SSP5-8.5, and Current Policy), covering 30 locations × 30 years (2020-2049) × all 6 SSP scenarios (~34,000 total records). The full product extends to 500-1000+ locations × 80 years (to 2100) × all 6 SSP scenarios (~10M+ records). It is suitable for various machine learning applications, including SSP scenario comparison, climate attribution, extreme event return period estimation, catastrophe modeling, carbon budget forecasting, and more.