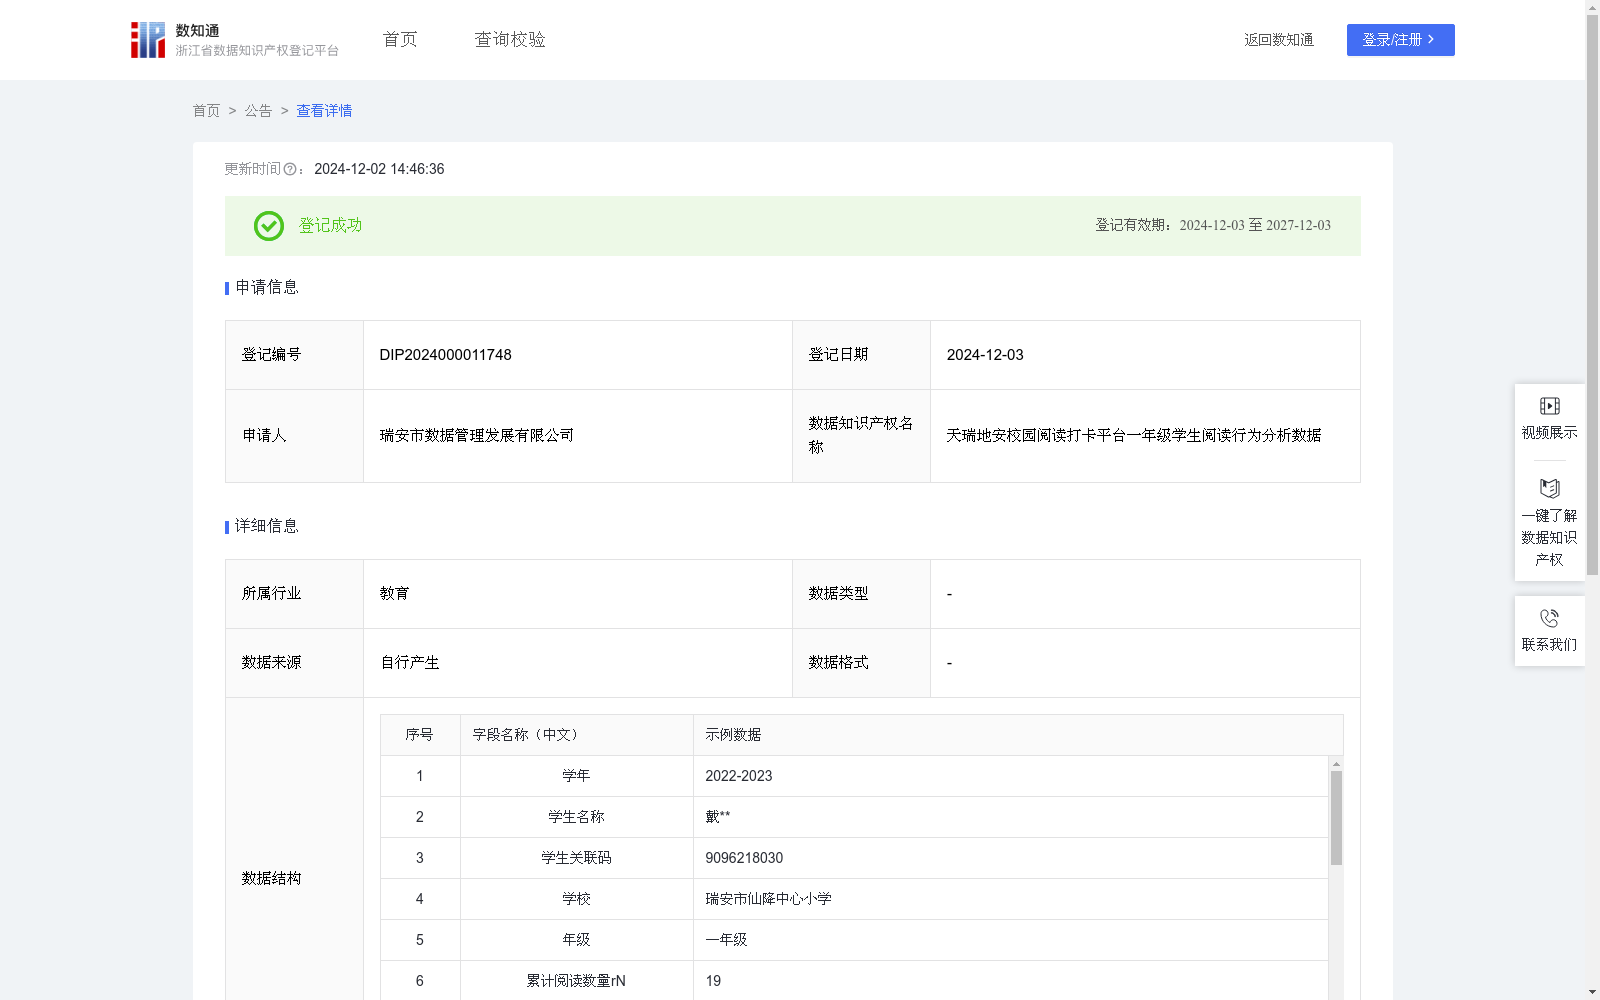
天瑞地安校园阅读打卡平台一年级学生阅读行为分析数据
收藏资源简介:
对天瑞地安APP校园阅读打卡平台上各年级段学生的阅读数据进行统计分析,对同一年级的学生数据做聚类分析,将学生的阅读情况进行迭代聚类,可以识别不同学生的阅读效果,可以使老师们了解到学生的阅读情况,从而实现更加精细化的学生管理,提升老师们的教学质量。同时,分析数据可以与书目类型数据结合,更有针对性的了解各年级段学生各类型书目的阅读情况,进而实现营销转化。数据采集:通过学生用户在天瑞地安APP上的阅读打卡行为,采集阅读过程中的时间、书目等数据;数据处理:在融媒综合管理平台上,通过机器学习分析学生阅读打卡的时间、书目、时长等数据,基于整体的打卡数据进行活跃度权重建模,将权重低于0.1的用户进行清洗;算法规则:将用户的累计阅读数量(变量1)、累计阅读时长(变量2)与累计阅读天数(变量3)进行归一化处理(减少极值数据对分析的影响),对归一化后的数据进行因子分析,将数据聚合为两个独立的公共因子(因子1反映变量1与变量2的信息,因子2反映变量3的信息),通过聚类分析(K-means算法)进行迭代分析产生三个聚类的中点(中心A、B、C),根据聚类迭代结果确定用户的聚类类型(Ad最小为类型A,Bd最小为类型B,Cd最小为类型C)与阅读等级标签(类型A、B、C分别对应低等级、中等级、高等级)。
This study conducts statistical analysis on the reading data of students across grade groups on the Tianrui Di'an APP campus reading check-in platform. Cluster analysis is performed on student data of the same grade, and iterative clustering of students' reading status is carried out to identify the reading performance of different students. This enables teachers to gain insight into students' reading situations, thereby achieving refined student management and improving teaching quality. Meanwhile, the analysis data can be combined with book category data to gain a more targeted understanding of the reading status of students in each grade group for different types of books, thus enabling marketing conversion. Data Collection: Data is collected through the reading check-in behaviors of student users on the Tianrui Di'an APP, including time spent reading, book titles and other relevant data during the reading process. Data Processing: On the Integrated Media Management Platform, machine learning is used to analyze data such as students' reading check-in time, book titles and reading duration. Activity weight modeling is conducted based on overall check-in data, and users with a weight lower than 0.1 are filtered out. Algorithm Framework: Three variables are used for analysis: cumulative number of books read (Variable 1), cumulative reading duration (Variable 2) and cumulative reading days (Variable 3). Normalization processing is first performed to reduce the impact of extreme values on the analysis. Factor analysis is then carried out on the normalized data, aggregating the data into two independent common factors: Factor 1 captures the information of Variable 1 and Variable 2, while Factor 2 captures the information of Variable 3. Iterative cluster analysis via the K-means algorithm is conducted to generate three cluster centroids (Centroid A, B, C). Based on the iterative clustering results, the user's cluster type and reading level tags are determined: users with the smallest distance to Centroid A are classified as Type A, those with the smallest distance to Centroid B as Type B, and those with the smallest distance to Centroid C as Type C. Type A, B and C correspond to low, medium and high reading levels respectively.