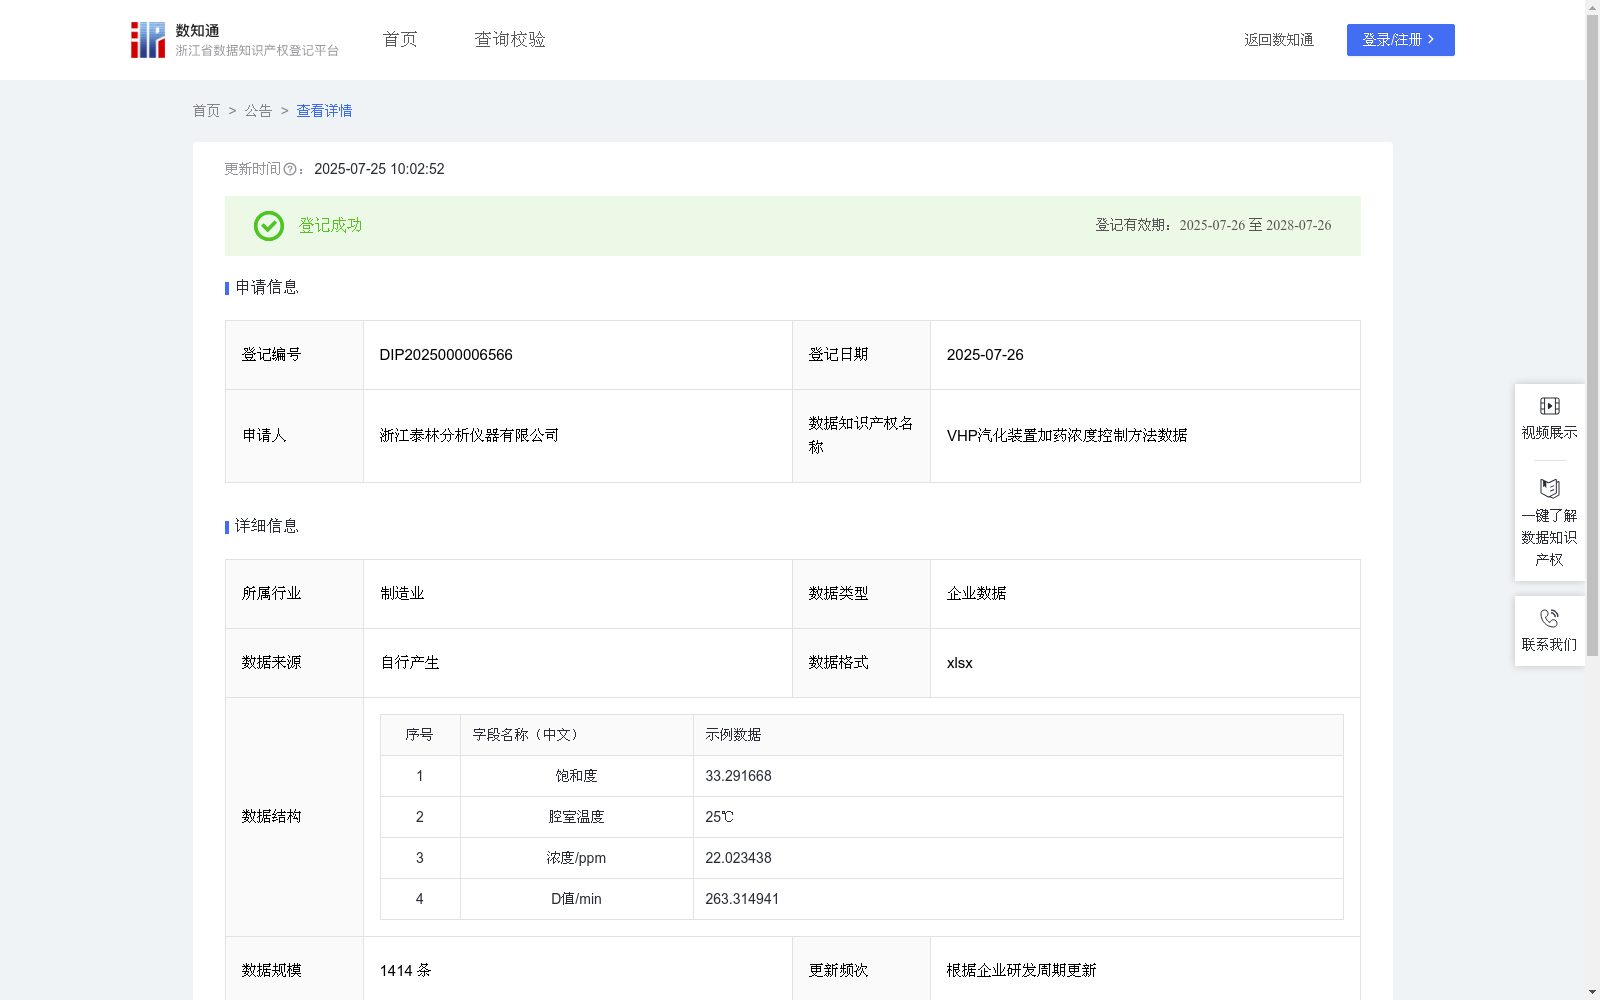
VHP汽化装置加药浓度控制方法数据
收藏资源简介:
本数据集合用于解决医疗 / 生物制药行业中过氧化氢灭菌设备(VHP 设备)的加药量精准控制问题。现有 VHP 设备存在理论加药浓度与出口实际浓度偏差大、灭菌饱和度难以精准调控的痛点,导致灭菌效果不稳定或药剂浪费。通过采集不同饱和度下的加药浓度(d)与 D 值(杀灭细菌所需时间 / 剂量)数据,构建浓度 - D 值指数关系模型,可反向推算特定灭菌效果所需的最佳加药浓度,实现:灭菌效率的替身和药剂成本降低。该数据集合可应用在的灭菌设备药剂控制中,成功将灭菌合格率从 92% 提升至 98%,具备显著的工业应用价值。① 数据采集: 固定一定温度条件下,调整灭菌腔体内过氧化氢饱和度; 记录每组饱和度对应的腔体出口H₂O₂浓度(*d*)及实测D值(微生物杀灭90%所需时间)。 ② 数据处理与建模: 将每组(*d*, D值)数据导入分析工具; 拟合指数函数:D = k·e^(a·d)(*k*、*a*为拟合系数); 通过回归分析确定系数*k*、*a*,生成“浓度-D值”曲线模型。 ③ 算法应用: 输入目标灭菌效果(预期D值); 基于函数模型反推最优加药浓度(*d*); 输出指导实际加药操作的浓度值。
This dataset is designed to solve the precise dosage control problem of vaporized hydrogen peroxide (VHP) sterilization equipment in the medical and biopharmaceutical industries. Current VHP equipment has major pain points including large deviations between the theoretical dosage concentration and the actual outlet concentration, and difficulty in accurately regulating sterilization saturation, which leads to unstable sterilization effects or wasted reagents. By collecting data of dosage concentration (d) and D-value (time/dosage required for bacterial killing) under different saturation levels, and constructing an exponential relationship model between concentration and D-value, the optimal dosage concentration required for a specific sterilization effect can be reversely calculated, thereby improving sterilization efficiency and reducing reagent costs. This dataset can be applied to the dosage control of sterilization equipment, successfully increasing the sterilization qualification rate from 92% to 98%, with significant industrial application value. ① Data Collection: Under a fixed temperature condition, adjust the hydrogen peroxide saturation in the sterilization chamber; record the outlet H₂O₂ concentration (d) and the measured D-value (time required for 90% microbial killing) corresponding to each group of saturation. ② Data Processing and Modeling: Import each set of (d, D-value) data into the analysis tool; fit the exponential function: D = k·e^(a·d), where k and a are fitting coefficients; determine the coefficients k and a through regression analysis, and generate the "concentration-D-value" curve model. ③ Algorithm Application: Input the target sterilization effect (expected D-value); reversely infer the optimal dosage concentration (d) based on the function model; output the concentration value to guide actual dosage operations.