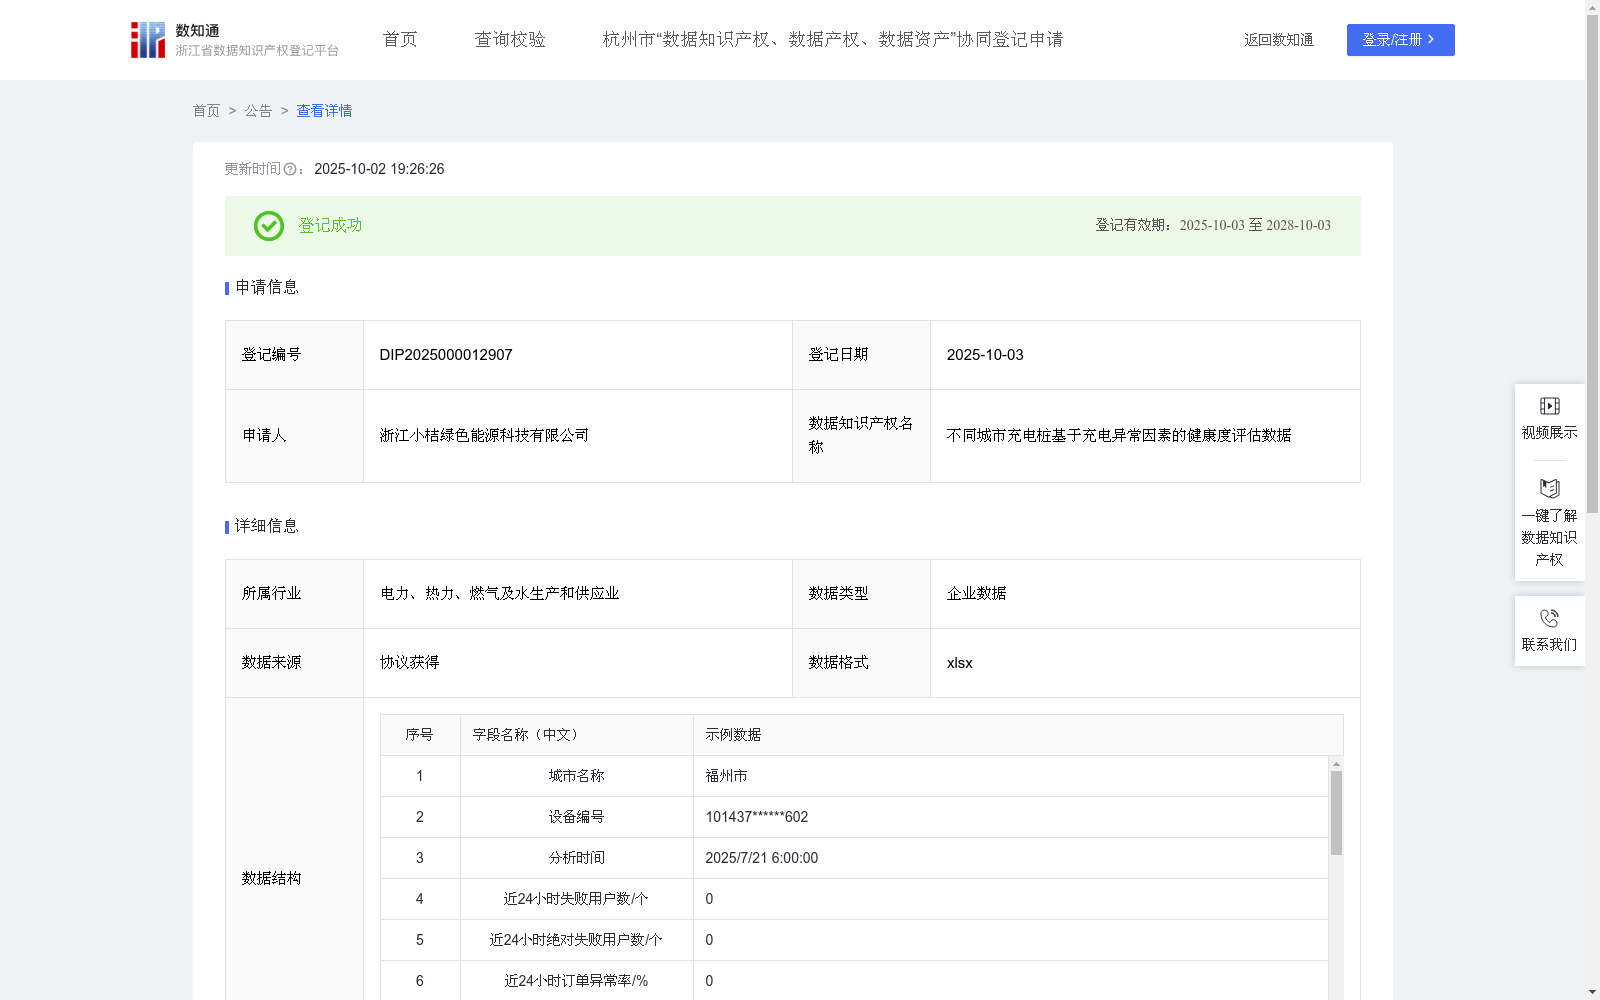
不同城市充电桩基于充电异常因素的健康度评估数据
收藏资源简介:
本数据集以城市为单位,结合充电异常行为指标,构建充电桩运行可靠性的健康度评分模型。具体应用场景如下: 1.对平台(即申请人)而言:可根据不同城市的异常健康度评分,对低健康度区域聚合预警,优先投放智能运维资源和客户告警提示机制,强化用户充电成功率保障; 2.对场站商家而言:可快速定位充电失败集中发生区域,识别站点潜在硬件老化或软故障趋势,作为售后维保服务规划的依据,提升运营稳定性; 3.对政府而言:可基于该评分方法开展城市级公共充电设施服务质量考核,作为评估政策补贴落地效果和优化布局方向的重要支撑数据。1.数据采集:原始数据经授权合法获取,按城市维度采集充电桩充电异常状态相关字段,包括:城市名称、设备编号、分析时间、近24小时失败用户数、近24小时绝对失败用户数、近24小时订单异常率、近7天挂起次数、近24小时失败用户占比、近24小时绝对失败用户占比、近30日挂起次数、用户在其他设备上的历史成功率(用户在其他设备上的历史成功率较高,则意味着本设备存在问题的概率越高)。 2.指标得分计算:依据不同指标的数值在历史数据中的分布情况和业务经验,采用分段函数进行归一化得分计算,得到近24小时失败用户数得分、近24小时绝对失败用户数得分、近24小时订单异常率得分、近7天挂起次数得分、近24小时失败用户占比得分、近24小时绝对失败用户占比得分、近30日挂起次数得分、用户历史满足率得分。 3.计算基于充电异常的健康度评分:(1)对近24小时失败用户数得分、近24小时绝对失败用户数得分、近24小时订单异常率得分、近7天挂起次数得分、近24小时失败用户占比得分、近24小时绝对失败用户占比得分、近30日挂起次数得分、用户历史满足率得分进行加权计算;(2)计算公式为:健康度评分=近24小时失败用户数得分*0.2+近24小时绝对失败用户数得分*0.37+近24小时订单异常率得分*0.08+近7天挂起次数得分*0.05+近24小时失败用户占比得分*0.1+近24小时绝对失败用户占比得分*0.1+近30日挂起次数得分*0.05+用户历史满足率得分*0.05;具体权重系数通过层次分析法(AHP)评估确定。
Taking cities as the basic statistical unit, this dataset develops a health score model for the operational reliability of charging piles by integrating charging anomaly behavior indicators. The specific application scenarios are as follows: 1. For the platform (i.e., the applicant): It can conduct aggregated early warnings for low-health regions based on the anomaly health scores of different cities, prioritize the allocation of intelligent operation and maintenance resources and activate customer alert mechanisms, and strengthen the guarantee of users' charging success rate; 2. For station merchants: It can quickly locate concentrated areas of charging failures, identify potential hardware aging or soft fault trends of the stations, serve as a basis for after-sales maintenance service planning, and improve operational stability; 3. For the government: It can carry out city-level public charging facility service quality assessments based on this scoring method, serving as important supporting data for evaluating the implementation effect of policy subsidies and optimizing the layout direction. 1. Data Collection: The original data is legally obtained with authorization, and fields related to the charging anomaly status of charging piles are collected by city, including: city name, equipment number, analysis time, number of failed users in the past 24 hours, absolute number of failed users in the past 24 hours, order anomaly rate in the past 24 hours, number of pending incidents in the past 7 days, proportion of failed users in the past 24 hours, absolute proportion of failed users in the past 24 hours, number of pending incidents in the past 30 days, and historical charging success rate of users on other devices (a higher historical success rate of the user on other devices indicates a higher probability that the current device has malfunctions). 2. Indicator Score Calculation: Based on the distribution of each indicator's values in historical datasets and practical business experience, a piecewise function is used to calculate normalized scores, yielding the scores of: number of failed users in the past 24 hours, absolute number of failed users in the past 24 hours, order anomaly rate in the past 24 hours, number of pending incidents in the past 7 days, proportion of failed users in the past 24 hours, absolute proportion of failed users in the past 24 hours, number of pending incidents in the past 30 days, and user historical satisfaction rate. 3. Calculation of Charging Anomaly-based Health Score: (1) Perform weighted calculation on the above eight indicator scores; (2) The calculation formula is: Health Score = Score of failed users in the past 24 hours * 0.2 + Score of absolute failed users in the past 24 hours * 0.37 + Score of order anomaly rate in the past 24 hours * 0.08 + Score of pending incidents in the past 7 days * 0.05 + Score of failed user proportion in the past 24 hours * 0.1 + Score of absolute failed user proportion in the past 24 hours * 0.1 + Score of pending incidents in the past 30 days * 0.05 + Score of user historical satisfaction rate * 0.05; The specific weight coefficients are determined through Analytic Hierarchy Process (AHP) evaluation.