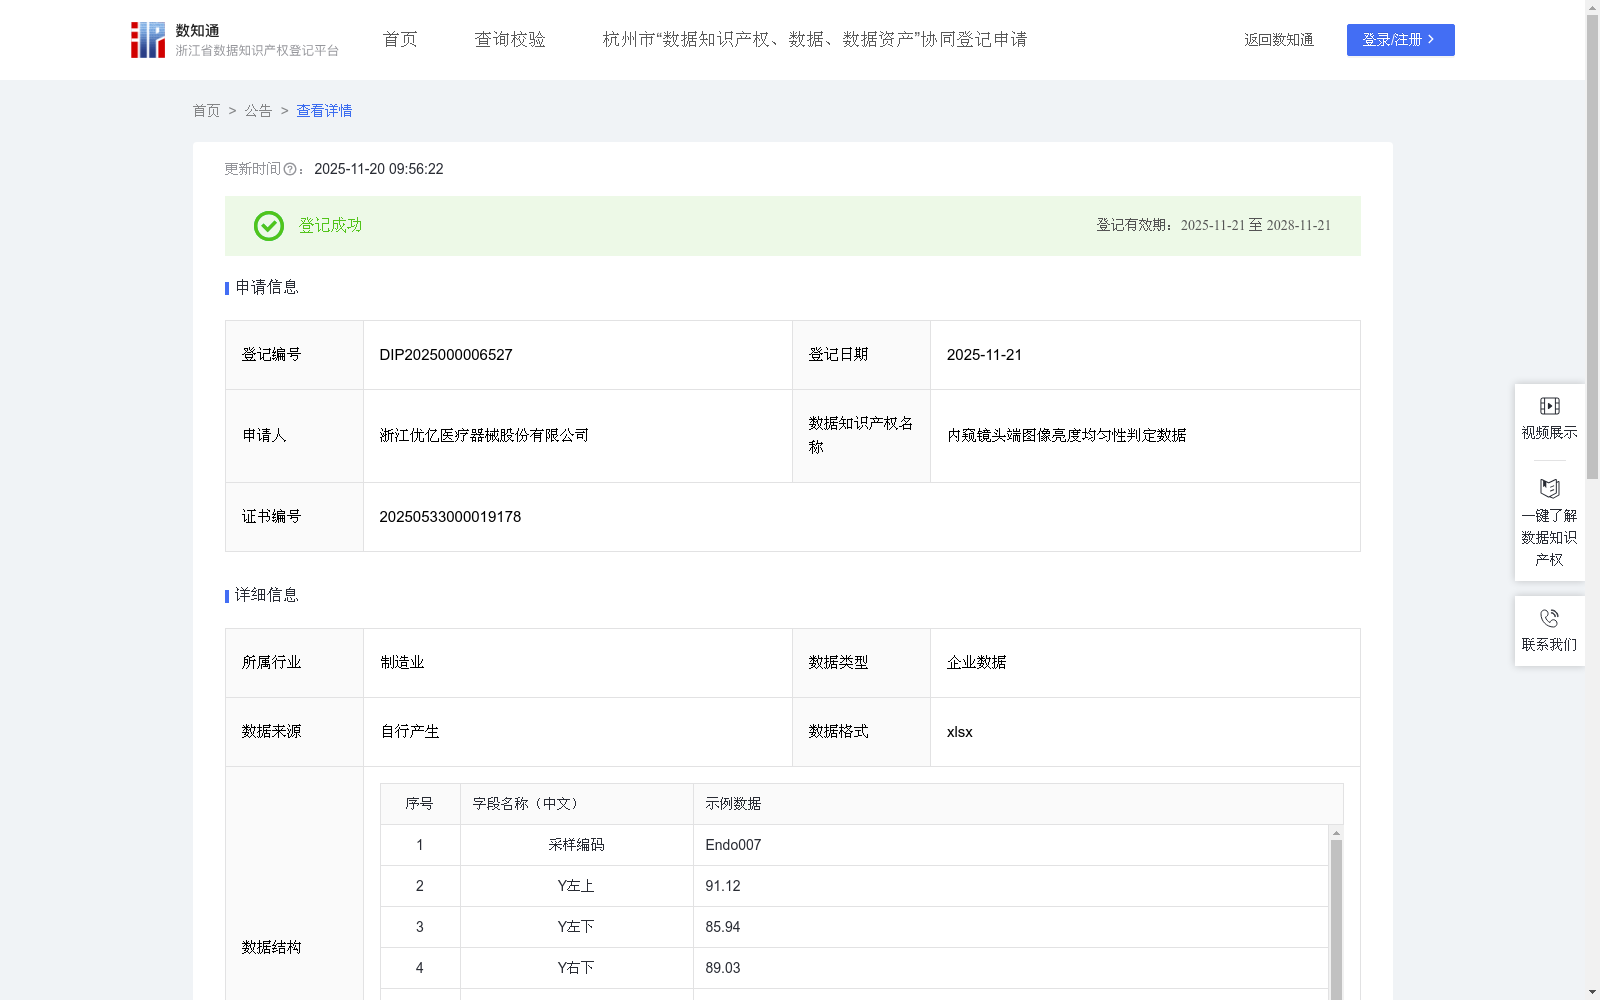
内窥镜头端图像亮度均匀性判定数据
收藏资源简介:
通过使用带光源内窥镜的摄像头,在全黑的环境下,使摄像头贴在毛玻璃上拍摄18%灰卡的照片。获取四角区域和中心区域的亮度值,进行Shading测试。主要是为了评估图像在不同区域(四角与中心)的亮度是否均匀。在内窥镜中,由于光学系统(如镜头)的特性、传感器的响应不均匀性等因素,可能会导致图像边缘区域的亮度与中心区域存在差异。通过 Shading 测试,可以量化这种亮度不均匀性,进而为图像校正、设备优化等提供依据,深入人体后,能够清晰的看清整张图片,不会出现中心和四角出现亮度不均匀的现象,便于医护人员能够看清整个图像包括四角。在开发基于内窥镜图像的AI辅助诊断系统(如识别息肉、肿瘤、出血点)时,模型对颜色非常敏感。本数据可以为AI团队提供色彩准确的“黄金标准”图像,用于模型训练和测试,避免因设备差异导致AI算法失效。同时本数据建立了一个基于客观数据的、可量化的“色彩真实性”标准,可推动行业标准化,推动整个内窥镜行业在色彩质量评估上形成统一标准,从“经验时代”迈向“数字时代”。1、数据获取:四角区域:在整幅图像的四个角落分别选取相同大小的区域。中心区域:在图像的中心位置选取一个与四角区域大小相同的区域。中心区域通常被认为是亮度较为理想、稳定的区域,将其作为基准,可以更直观地对比其他区域的亮度偏差。 2、计算规则:以中心区域的亮度值为基准,计算四角区域的亮度值与中心区域亮度值的比值。这一步是为了量化四角区域相对于中心区域的亮度差异。分别获取左上、左下、右下、右上四角区域的亮度值,使用MIN函数从四角区域的亮度值中找出最小值,即四角最暗处的亮度值,即Ymin=MIN(Y左上、Y左下、Y右下、Y右上),然后将四角最暗处的亮度值与中心区域亮度值进行比值再乘以 100%,得到 Shading 值。即 Shading 值 =(四角最暗处的亮度值 Ymin / 中心最亮处的亮度值Y中心)× 100%。Shading 值的范围通常在 0 到 100% 之间,越接近 100% 表示图像的亮度均匀性越好,即四角区域的亮度与中心区域的亮度差异越小;如果 Shading 值较低,说明图像存在较明显的亮度不均匀性,四角区域相对于中心区域的亮度明显偏低。 3、数据应用:在图像处理过程中,Shading 测试结果可以作为图像校正的依据。根据 Shading 值,可以对图像进行亮度补偿或校正算法的调整,使得Shading 值尽可能接近100%,以提高图像的整体质量,使图像在不同区域的亮度更加均匀,更接近真实场景的亮度分布。本数据设定符合输出标准的Shading 值需要大于等于75%,当符合标准时,输出结果为OK,反之输出NG。 单位说明:在图像处理中,亮度值和Shading 值为像素值,范围从0到255(对于8位图像)或0到65535(对于16位图像),无单位。
This dataset is collected by using a camera fitted with a light-source endoscope, positioning the camera against frosted glass to capture images of an 18% gray card in a fully dark environment. The brightness values of the four corner regions and the central region are extracted to conduct the Shading test, which aims to evaluate whether the image brightness is uniform across different regions (corners vs. center). In endoscopes, factors such as the characteristics of the optical system (e.g., lenses) and the non-uniform response of the image sensor may cause brightness differences between the edge regions and the central area of the image. The Shading test can quantify this brightness non-uniformity, providing a basis for image correction and device optimization. When the endoscope is inserted deep into the human body, clear and uniform images without brightness discrepancies between the center and corners can be obtained, facilitating medical staff to view the entire image including its corners. When developing AI-assisted diagnosis systems based on endoscopic images (e.g., for identifying polyps, tumors and bleeding spots), the model is highly sensitive to color. This dataset can provide AI teams with "gold standard" images with accurate colors for model training and testing, preventing AI algorithms from failing due to device differences. Additionally, this dataset establishes an objective, quantifiable "color authenticity" standard, which can promote industry standardization, unify the color quality evaluation criteria for the entire endoscopy industry, and shift the industry from an "experience-based era" to a "digital era". 1. Data Acquisition: Four corner regions: Select regions of the same size from each of the four corners of the full image. Central region: Select a region of the same size as the corner regions from the image center. The central region is generally considered to have ideal and stable brightness, so it is used as a reference to intuitively compare the brightness deviation of other regions. 2. Calculation Rules: Take the brightness value of the central region as the reference, and calculate the ratio of the brightness values of the four corner regions to that of the central region to quantify the brightness difference of the corner regions relative to the central area. First, obtain the brightness values of the four corner regions (top-left, bottom-left, bottom-right, top-right). Use the MIN function to find the minimum brightness value among the four corners, i.e., the brightness of the darkest corner: Y_min = MIN(Y_top-left, Y_bottom-left, Y_bottom-right, Y_top-right). Then calculate the Shading value by multiplying the ratio of Y_min to the central region brightness value by 100%, i.e., Shading Value = (Y_min / Y_central) × 100%. The Shading value typically ranges from 0 to 100%. The closer it is to 100%, the better the image brightness uniformity, meaning the smaller the brightness difference between the corner regions and the central area. A lower Shading value indicates significant brightness non-uniformity in the image, with the corner regions being noticeably darker than the central region. 3. Data Application: During image processing, the Shading test results can serve as a basis for image correction. Based on the Shading value, brightness compensation or adjustment of correction algorithms can be performed to bring the Shading value as close to 100% as possible, thereby improving the overall image quality, making the brightness across different regions more uniform and closer to the brightness distribution of the real scene. This dataset specifies that a qualified Shading value should be greater than or equal to 75%. When the standard is met, the output result is "OK"; otherwise, the output is "NG". Unit Description: In image processing, brightness values and Shading values are pixel values, ranging from 0 to 255 for 8-bit images or 0 to 65535 for 16-bit images, with no unit.