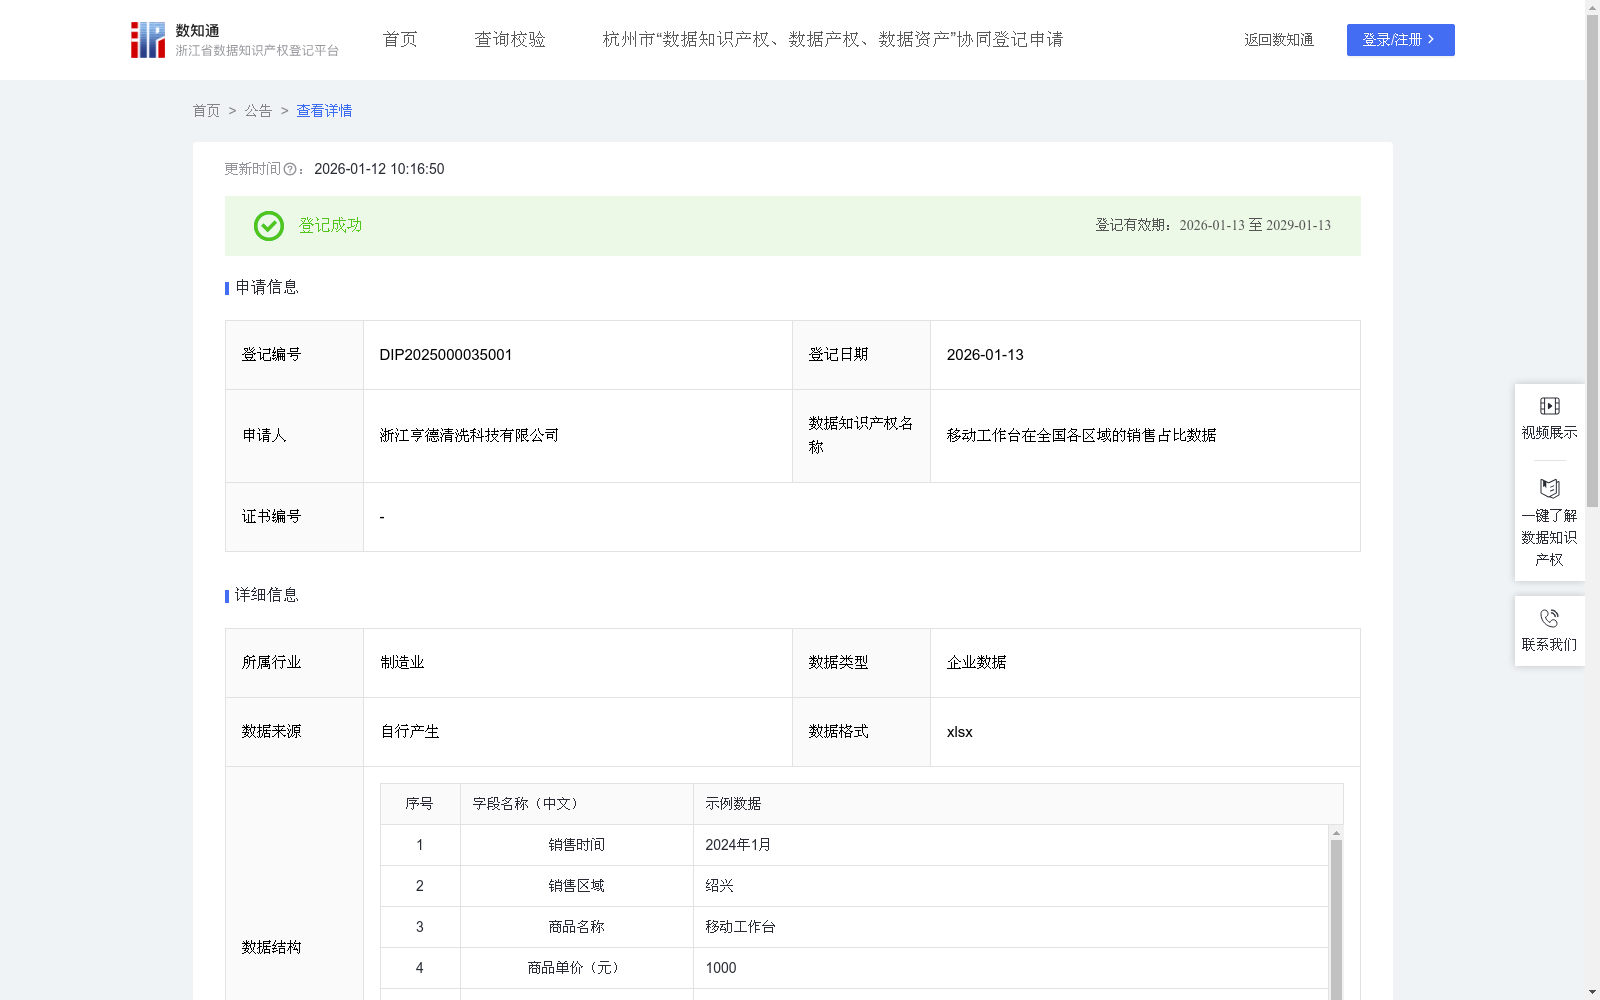
移动工作台在全国各区域的销售占比数据
收藏资源简介:
通过统计移动工作台在全国各区域的销售占比数据,对各区域进行销售等级划分,帮助企业精准定位经营方向,实施差异化的区域经营策略,也助力同行企业精准洞察市场动态,制定针对性的营销方案,平衡短期收益与长期布局,通过资源的高效配置,持续提升客户满意度和市场竞争力。1.数据采集:依据公司销售数据中收集移动工作台每月在全国各区域的销售相关数据,包括销售时间、销售区域、商品单价(元)、成交数(台)、销售额(元)、各区域销售总金额(元),总销售金额(元)等字段。 2.数据处理:根据商品单价(元)和成交数(台),统计销售额(元)=商品单价(元)*成交数(台);根据销售额(元)和销售区域字段用SUMIF函数求和,得出各区域销售总金额(元);根据销售额(元)字段用SUM函数求和得出总销售金额(元);销售占比=各区域销售总金额(元)/总销售金额(元)*100%。 3.数据分类:将各地区的年销售总金额占总销售金额的比例按从大到小进行排名,并将销售等级分为ABCD四类,A类销售为销售占比在大于等于10%以上;B类销售为销售占比在大于等于5%到小于10%之间;C类销售为销售占比在大于等于1%到小于5%之间;D类销售为销售占比小于1%以下。 4.数据应用:通过分析移动工作台各地区的销售数据,企业可以更好的规划今后在各区域的经营方案,加大在A类销售区域的资源投入,如增加常规价产品铺货量、推出区域定制化促销方案;重点稳固在B类和C类销售区域的销量,如通过推广活动吸引消费者;减少在D类销售区域的销售推广,仅保留基础渠道覆盖,优先跟进有潜在需求的企业客户为企业获得更大的收益。
This dataset is developed by calculating the sales proportion of mobile workstations across all regions nationwide to classify sales tiers for each region. It helps enterprises accurately position their business directions and implement differentiated regional operation strategies, while also assisting peer enterprises to accurately gain insights into market trends, formulate targeted marketing plans, balance short-term revenue and long-term layout, optimize resource allocation, and continuously improve customer satisfaction and market competitiveness. 1. Data Collection: Monthly sales-related data of mobile workstations across all regions nationwide is sourced from the company's sales records, including fields such as sales time, sales region, unit price of goods (yuan), transaction volume (units), individual sales amount (yuan), total sales amount of each region (yuan), and total overall sales amount (yuan). 2. Data Processing: Calculate individual sales amount (yuan) = unit price of goods (yuan) × transaction volume (units); Use the SUMIF function to sum up the total sales amount of each region (yuan) based on the individual sales amount (yuan) and sales region fields; Use the SUM function to calculate the total overall sales amount (yuan) based on the individual sales amount (yuan) field; The sales proportion = (total sales amount of a region / total overall sales amount) × 100%. 3. Data Classification: Rank the annual sales proportion of each region in descending order, and divide the sales tiers into four categories: A, B, C and D. Category A refers to regions with a sales proportion of ≥10%; Category B refers to regions with a sales proportion of ≥5% and <10%; Category C refers to regions with a sales proportion of ≥1% and <5%; Category D refers to regions with a sales proportion of <1%. 4. Data Application: By analyzing the regional sales data of mobile workstations, enterprises can better plan their future regional operation plans: increase resource investment in Category A sales regions, such as expanding the inventory of standard-priced products and launching region-specific promotional campaigns; focus on stabilizing sales volume in Category B and C sales regions, such as attracting consumers through promotional activities; reduce sales promotion efforts in Category D sales regions, only retain basic channel coverage, and prioritize follow-up with enterprise customers with potential demands to obtain greater revenue for the enterprise.