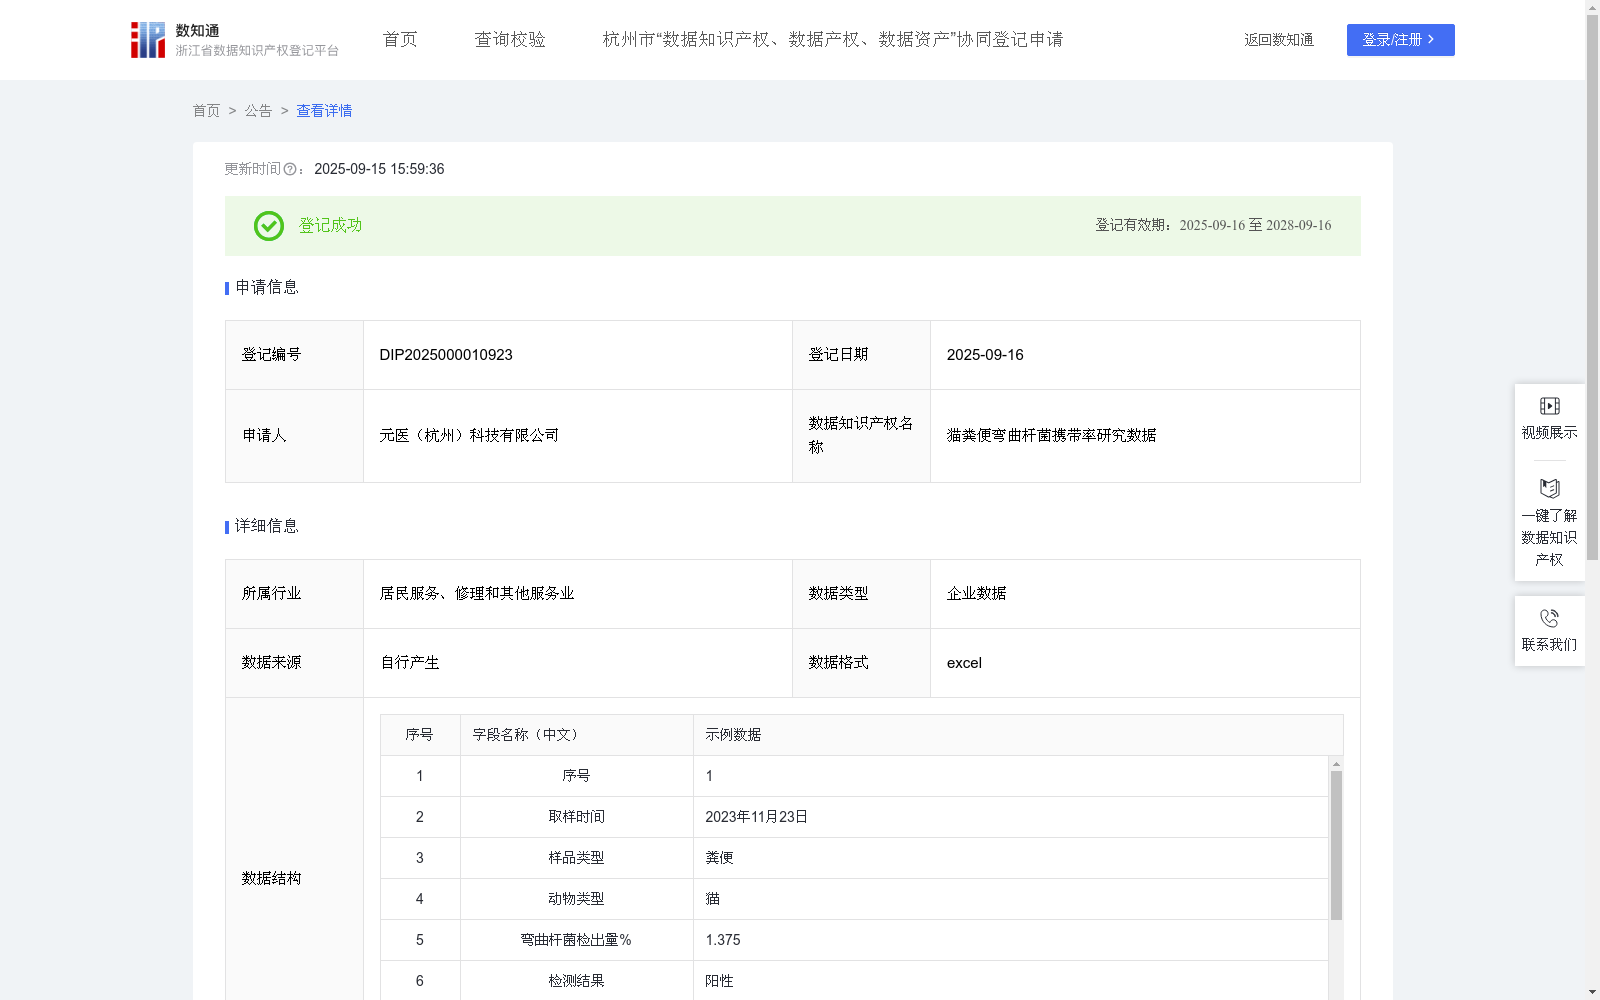
猫粪便弯曲杆菌携带率研究数据
收藏资源简介:
弯曲杆菌是引起动物胃肠炎的最常见病因之一,可引发宠物的腹泻、呕吐、发热等症状。弯曲杆菌可在人与宠物之间传播,是一种人畜共患菌,严重影响人类健康。了解猫粪便中弯曲杆菌的携带率对于评估公共卫生风险具有重要意义,为疾病预防和控制提供科学依据,保障宠物及人类健康。猫粪便弯曲杆菌携带率研究还可以为流行病学的研究提供数据支持,有助于确定中国本土区域宠物弯曲杆菌的本底流行水平,为判断后续可能出现的异常流行情况提供基线参照。1、数据采集:从宠物医院收集一批(503只)猫粪便样本,按照1-503的顺序进行样本编号,并对基础信息、临床资料进行分析调查。2、数据检测:对收集到的503只动物粪便样本分别进行16S微生物测序,按照16S微生物测序数据分析流程进行数据分析,在属水平上统计弯曲杆菌检出量%,弯曲杆菌检出量%大于0的样本检测结果标记为阳性,等于0 的检测结果标记为阴性。3、数据处理:① 统计阳性总数,平均携带率=阳性总数/样本总数;② 平均携带丰度%=AVERAGE(弯曲杆菌检出量%);③ 将弯曲杆菌检出量%按照从小到大的顺序排序,四分位数Q3=3 (n + 1)/4位置的检测数值,n为样本总数。4、数据应用:利用PYTHON收集群体样本弯曲杆菌检出量%,用MATPLOTLIB将该数据画出拟合图,便于研究人员观察分析。5、数据分类分级:将计算出的弯曲杆菌菌检出量%进行指标评价,分为“高、中、低“不同的类别和级别(弯曲杆菌检出量%值大于四分位数Q3的为“高”,大于0且小于等于Q3为“中”,值为0的为“低”)。
Campylobacter is one of the most common causative agents of animal gastroenteritis, which can trigger symptoms including diarrhea, vomiting and fever in pets. As a zoonotic bacterium capable of transmitting between humans and pets, Campylobacter severely impacts human health. Investigating the carriage rate of Campylobacter in cat feces holds great significance for assessing public health risks, providing scientific evidence for disease prevention and control, and protecting the health of both pets and humans. Such research can also offer data support for epidemiological studies, help determine the baseline prevalence of pet Campylobacter in local regions of China, and provide a baseline reference for identifying subsequent abnormal epidemic events. 1. Data Collection: A total of 503 cat fecal samples were collected from pet hospitals, sequentially numbered from 1 to 503, and basic information and clinical data were analyzed and surveyed. 2. Data Detection: 16S microbial sequencing was performed on each of the 503 fecal samples. Data analysis was conducted following the standard 16S microbial sequencing data analysis workflow, and the relative abundance of Campylobacter at the genus level was quantified. Samples with a relative abundance of Campylobacter greater than 0 were marked as positive, while those with a value equal to 0 were marked as negative. 3. Data Processing: ① Calculate the total number of positive samples, with the average carriage rate = total number of positive samples / total number of samples; ② The average detection abundance (%) = AVERAGE(Campylobacter relative abundance (%)); ③ Sort the Campylobacter relative abundance (%) in ascending order, where the third quartile Q3 is the value at the position of 3*(n+1)/4, with n representing the total number of samples. 4. Data Application: Use Python to collect the relative abundance (%) of Campylobacter across the population samples, and generate a fitting plot using matplotlib to facilitate observation and analysis by researchers. 5. Data Classification and Grading: Evaluate the calculated Campylobacter relative abundance (%) into three categories: "high", "medium" and "low". Specifically, samples with relative abundance greater than Q3 are classified as "high", those with relative abundance greater than 0 and less than or equal to Q3 are classified as "medium", and those with a value of 0 are classified as "low".