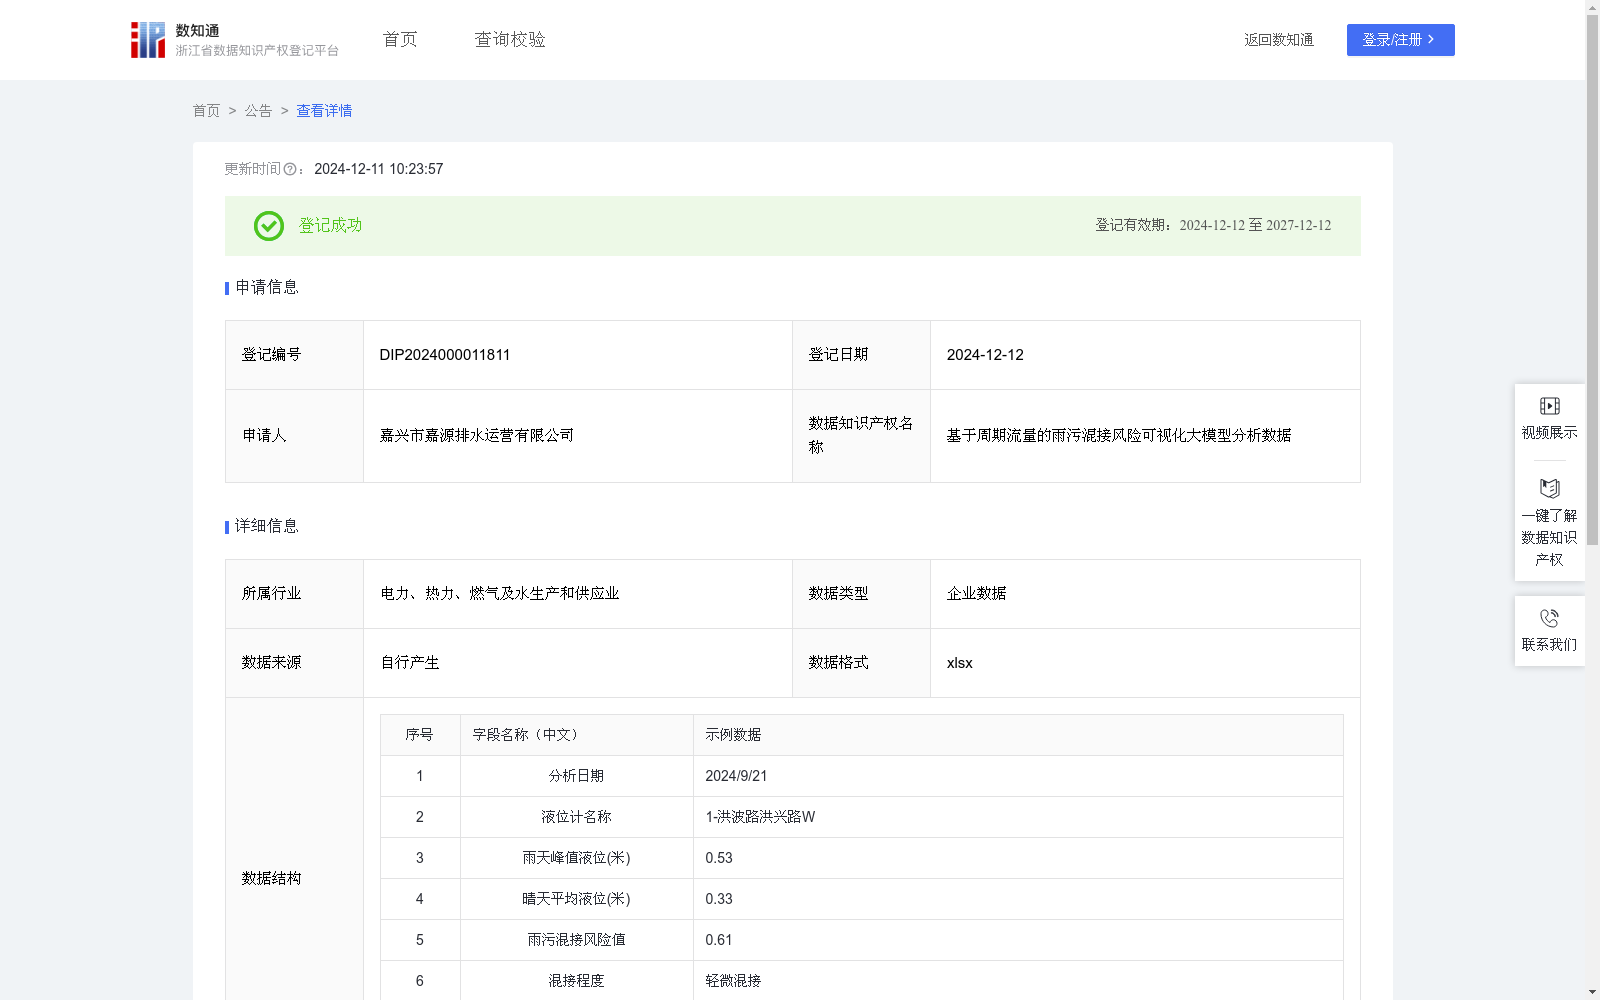
基于周期流量的雨污混接风险可视化大模型分析数据
收藏资源简介:
在城市化进程中,雨污分流改造不彻底会导致雨污混接现象层出不穷。当雨水流入污水管道,会稀释污水浓度并且增大污水管道中的水量,对末端污水厂的运行带来压力,导致进厂水量超负荷及水质不达标等问题,同时也会增加管道淤积、污水外溢、城市内涝风险,影响城市风貌。通过基于周期流量的雨污混接风险可视化大模型,分析获得雨污混接风险数据,以此绘制雨污风险分布图,有效排查雨污错接、混接、漏接问题,实现问题管道实时监测、精准定位,为有关部门优化地下管网建设、规划混接点改造工程提供数据支持,对改善水质环境、提高污水处理效率具有重要意义。算法原理: 若污水管网某处存在雨污混接,则雨天会导致大量雨水进入污水管道,管道附近流量会明显增大,检查井液位显著升高。因此,对液位计所在检查井进行晴天和雨天的液位数据分析,获得雨污混接风险值,通过风险值分级评估此液位计上游存在雨污混接的程度。 数据采集: 液位计能够实时对污水管网的污水液位进行监测。系统对各液位计按地理位置进行编号,并通过物联网采集各个液位计的监测数据,采集频率为1分钟/次。 数据分析: 单个周期的数据分析时长为2个月。系统对两个月内所有降雨事件(总降雨量至少2mm;总历时至少10min)进行统计分析。期间雨天时液位的最高值,即【雨天峰值液位】,期间晴天时的液位均值,即【晴天平均液位】。 【雨污混接风险值】=(【雨天峰值液位】-【晴天平均液位】)/【晴天平均液位】。 (1)【雨污混接风险值】<=0.5,无混接; (2)0.5<【雨污混接风险值】<=1.5, 轻微混接; (3)1.5<【雨污混接风险值】<=2,中等混接; (4)【雨污混接风险值】>2,严重混接; 根据该分析数据生成可视化雨污混接风险预警图,实现混接风险实时监测及时排查。
During urbanization, incomplete renovation of separate rainwater and sewage pipe systems leads to frequent cross-connections between rainwater and sewage pipelines. When rainwater flows into sewage pipelines, it dilutes the sewage concentration and increases the water volume in the pipelines, imposing operational pressure on downstream wastewater treatment plants, leading to issues such as influent water overload and substandard water quality. Additionally, it elevates the risks of pipeline siltation, sewage overflow, and urban waterlogging, which negatively impacts urban aesthetics. By leveraging a periodic flow-based large-scale model for rainwater-sewage cross-connection risk visualization, we analyze and obtain risk data of such cross-connections, then generate rainwater-sewage risk distribution maps. This effectively identifies rainwater-sewage misconnections, cross-connections, and missed connections, enables real-time monitoring and accurate positioning of problematic pipelines, provides data support for relevant departments to optimize underground pipe network construction and plan cross-connection renovation projects, and holds significant importance for improving water quality environments and enhancing wastewater treatment efficiency. Algorithm Principle: If there is a rainwater-sewage cross-connection at a certain point in the sewage pipe network, heavy rain will cause a large amount of rainwater to enter the sewage pipelines, leading to a significant increase in the flow rate near the pipelines and a sharp rise in the liquid level of manholes. Therefore, by analyzing the liquid level data of the manholes where the level gauges are installed under both sunny and rainy conditions, we can obtain the rainwater-sewage cross-connection risk value, and evaluate the degree of cross-connection upstream of the level gauge through risk value grading. Data Collection: Level gauges can monitor the sewage liquid level in the sewage pipe network in real time. The system numbers each level gauge according to its geographical location, and collects monitoring data from all level gauges via the Internet of Things (IoT), with a collection frequency of once per minute. Data Analysis: The duration of data analysis for a single cycle is 2 months. The system performs statistical analysis on all rainfall events within the two-month period (with total rainfall of at least 2 mm and total duration of at least 10 minutes). The highest liquid level during rainy periods is defined as [Rainy Peak Liquid Level], while the average liquid level during sunny periods is defined as [Sunny Average Liquid Level]. [Rainwater-Sewage Cross-Connection Risk Value] = ([Rainy Peak Liquid Level] - [Sunny Average Liquid Level]) / [Sunny Average Liquid Level]. (1) [Rainwater-Sewage Cross-Connection Risk Value] ≤ 0.5: No cross-connection; (2) 0.5 < [Rainwater-Sewage Cross-Connection Risk Value] ≤ 1.5: Slight cross-connection; (3) 1.5 < [Rainwater-Sewage Cross-Connection Risk Value] ≤ 2: Moderate cross-connection; (4) [Rainwater-Sewage Cross-Connection Risk Value] > 2: Severe cross-connection; Visualized early warning maps of rainwater-sewage cross-connection risks are generated based on this analysis data, enabling real-time monitoring and timely troubleshooting of cross-connection risks.