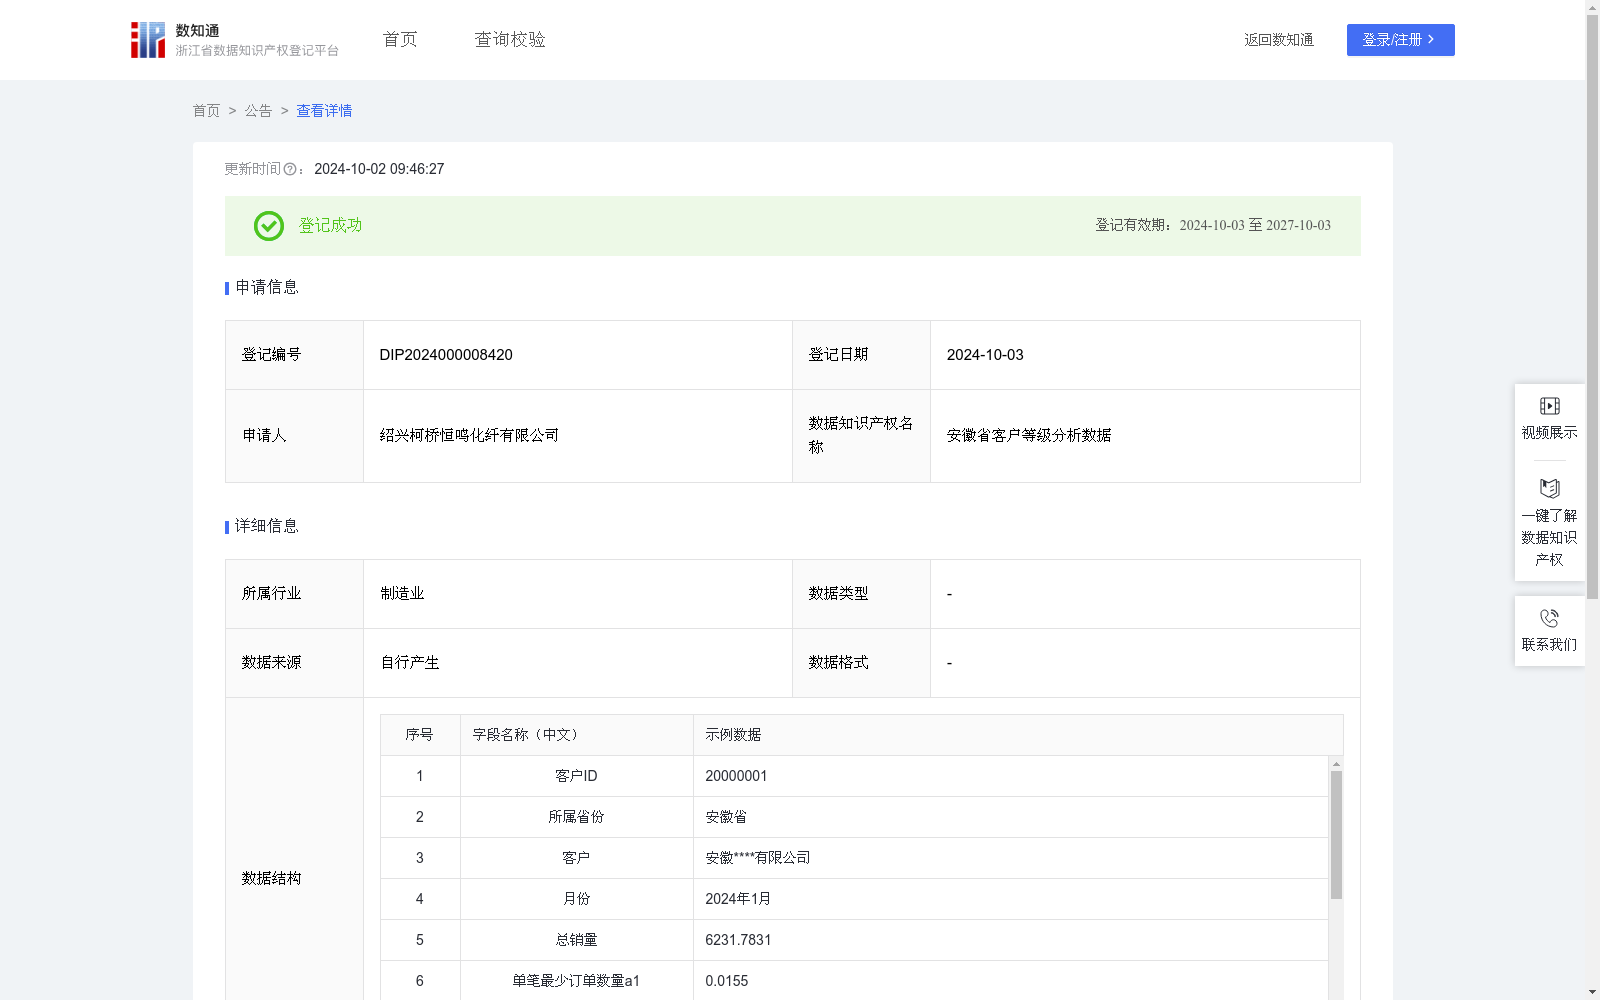
安徽省客户等级分析数据
收藏资源简介:
通过对安徽省内客户的销售及订单数据分析,可以识别出哪些客户对纺织产品的需求更高,从而更加精准地进行市场定位和营销策略的制定。在“销售策略制定”“客户关系管理”“供应链优化”“产品开发与改进”等方面对安徽省区域的所有纺织业企业有重要应用用途,企业可以了解客户的购买习惯和规模,进而设计更加合理的促销活动和销售策略,增强高等级客户满意度和忠诚度。企业可以准确地预测未来的销售需求,合理安排生产计划、库存管理和物流配送,降低库存及运输成本,提高供应链的整体效率。通过对客户需求的深入了解,企业可以开发新产品或改进现有产品以满足客户的特定需求,从而提高市场竞争力。1. 数据采集:从业务系统中收集销售数据。 2. 数据处理:对采集到的数据进行数据清理,然后按销售策略根据不同的区域权重,进行数据预加工(去重、分类、合并、累加等); 3. 算法规则: 需求指数P={a1(单笔最少订单数量)/b1(单笔最少消费额度)+a2(单笔最高订单数量)/b2(单笔最高消费额度)+a3(平均订单数量)/b3(平均消费额度)}*k*100,k为消费系数 P的结果推送:320分以上高等级,200到320分中等级,200分一下低等级 4. 数据应用:根据客户等级,识别出重要的客户,给后续CRM、供应链优化、销售策略制定等提供依据。
By analyzing sales and order data of customers in Anhui Province, this dataset can identify which customers have higher demand for textile products, enabling more precise market positioning and marketing strategy formulation. This dataset has important application value for all textile enterprises in Anhui Province in aspects such as sales strategy formulation, customer relationship management (CRM), supply chain optimization, and product development and improvement. Enterprises can gain insights into customers' purchasing habits and order scales, design more reasonable promotional activities and sales strategies, and enhance the satisfaction and loyalty of high-tier customers. Enterprises can accurately forecast future sales demands, reasonably arrange production plans, inventory management and logistics distribution, reduce inventory and transportation costs, and improve the overall efficiency of the supply chain. By gaining an in-depth understanding of customer needs, enterprises can develop new products or improve existing ones to meet customers' specific requirements, thereby enhancing their market competitiveness. 1. Data Collection: Collect sales data from business systems. 2. Data Processing: Perform data cleaning on the collected data, then conduct data preprocessing (including deduplication, classification, merging, accumulation, etc.) according to different regional weights based on sales strategies; 3. Algorithm Rules: Demand Index P = {a1 (minimum order quantity per transaction)/b1 (minimum consumption amount per transaction) + a2 (maximum order quantity per transaction)/b2 (maximum consumption amount per transaction) + a3 (average order quantity)/b3 (average consumption amount)} * k * 100, where k is the consumption coefficient. P Result Classification: High-tier customers with scores above 320, medium-tier customers with scores ranging from 200 to 320, and low-tier customers with scores below 200. 4. Data Application: Identify key customers based on their customer tiers, providing a reliable basis for subsequent CRM, supply chain optimization, sales strategy formulation and other related work.