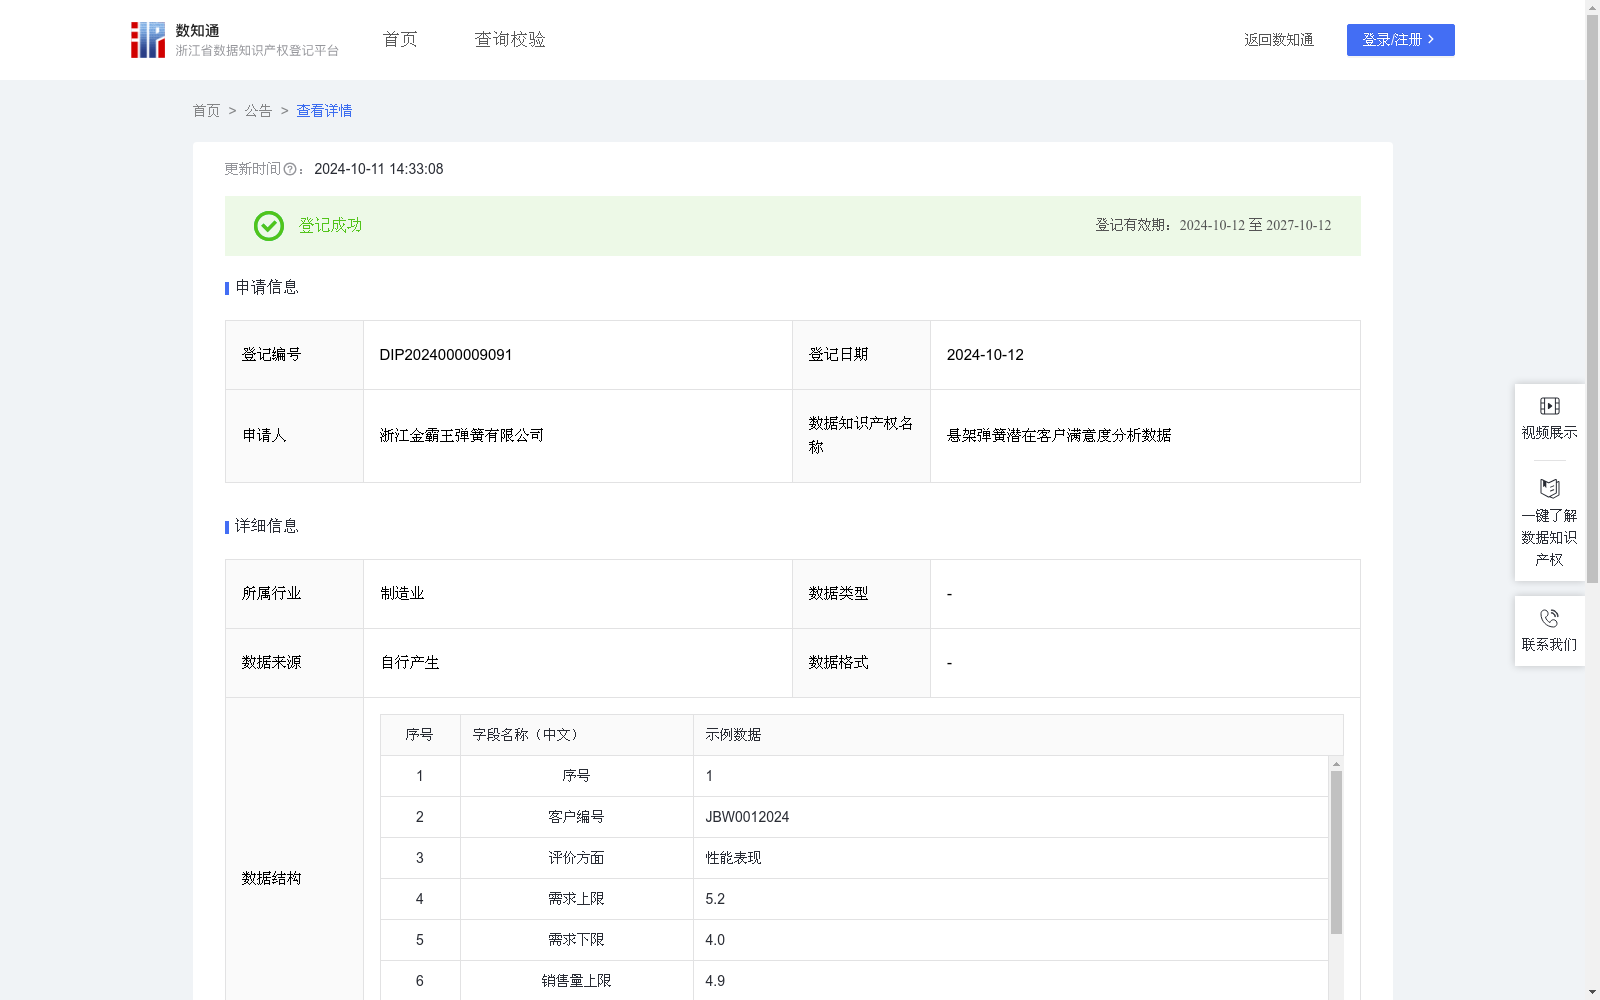
悬架弹簧潜在客户满意度分析数据
收藏资源简介:
通过收集浙江地区客户对悬架弹簧的订单满意度数据,基于客户对弹簧性能、耐用性等需求的极限值和波动范围,优化产品设计,以满足更广泛的客户需求,制定针对性的市场定位和营销策略,提高市场竞争力。识别服务中的不足,优化售后服务流程,提升客户体验。1.数据采集:通过问卷调查、在线评价、市场调研等方式,收集大量客户对悬架弹簧的需求数据,包括性能、耐用性等方面的极限需求和日常需求。收集组织提供的悬架弹簧的实际性能数据,包括性能表现、耐用性等。 2.数据处理:去除重复、无效或异常的数据记录,确保数据的准确性和可靠性,对数据进行标准化处理,以便在不同维度和指标间进行比较和分析。 3.算法加工:将处理后的数据进行分析:潜在客户满意度=(需求上限USL-需求下限LSL)/(销售量上限UCL-下限LCL)*客户需求标准差sn/销售量标准差sp。 4.数据分类分级:满意度小于1:很差;满意度大于1且小于等于1.5:合格;满意度大于1.5:优秀,根据客户满意度评价结果,调整产品设计、生产流程、市场策略及售后服务,以提升客户满意度和忠诚度。
This dataset is constructed by collecting customer order satisfaction data for suspension springs in the Zhejiang region. Based on the extreme values and fluctuation ranges of customers' demands for spring performance, durability and other attributes, it aims to optimize product design, meet the needs of a broader customer base, formulate targeted market positioning and marketing strategies, and enhance market competitiveness. Additionally, it identifies deficiencies in service, optimizes after-sales service processes, and improves customer experience. 1. Data Collection: A large volume of customer demand data for suspension springs is collected via questionnaires, online reviews, market research and other approaches, covering both extreme and daily demands in terms of performance, durability and other aspects. Actual performance data of suspension springs provided by the organization is also collected, including performance metrics, durability and other related indicators. 2. Data Processing: Duplicate, invalid or abnormal data records are removed to ensure the accuracy and reliability of the dataset, and standardization processing is conducted on the data to enable comparison and analysis across different dimensions and indicators. 3. Algorithm Processing: The processed data is analyzed using the following formula: Potential Customer Satisfaction = (Upper Specification Limit of Demand (USL) - Lower Specification Limit of Demand (LSL)) / (Upper Control Limit of Sales Volume (UCL) - Lower Control Limit of Sales Volume (LCL)) * (Standard Deviation of Customer Demand sn / Standard Deviation of Sales Volume sp). 4. Data Classification and Grading: Customer satisfaction is classified into three tiers: Poor (satisfaction < 1), Qualified (1 < satisfaction ≤ 1.5), and Excellent (satisfaction > 1.5). Product design, production processes, marketing strategies and after-sales services are adjusted based on the customer satisfaction evaluation results to improve customer satisfaction and loyalty.