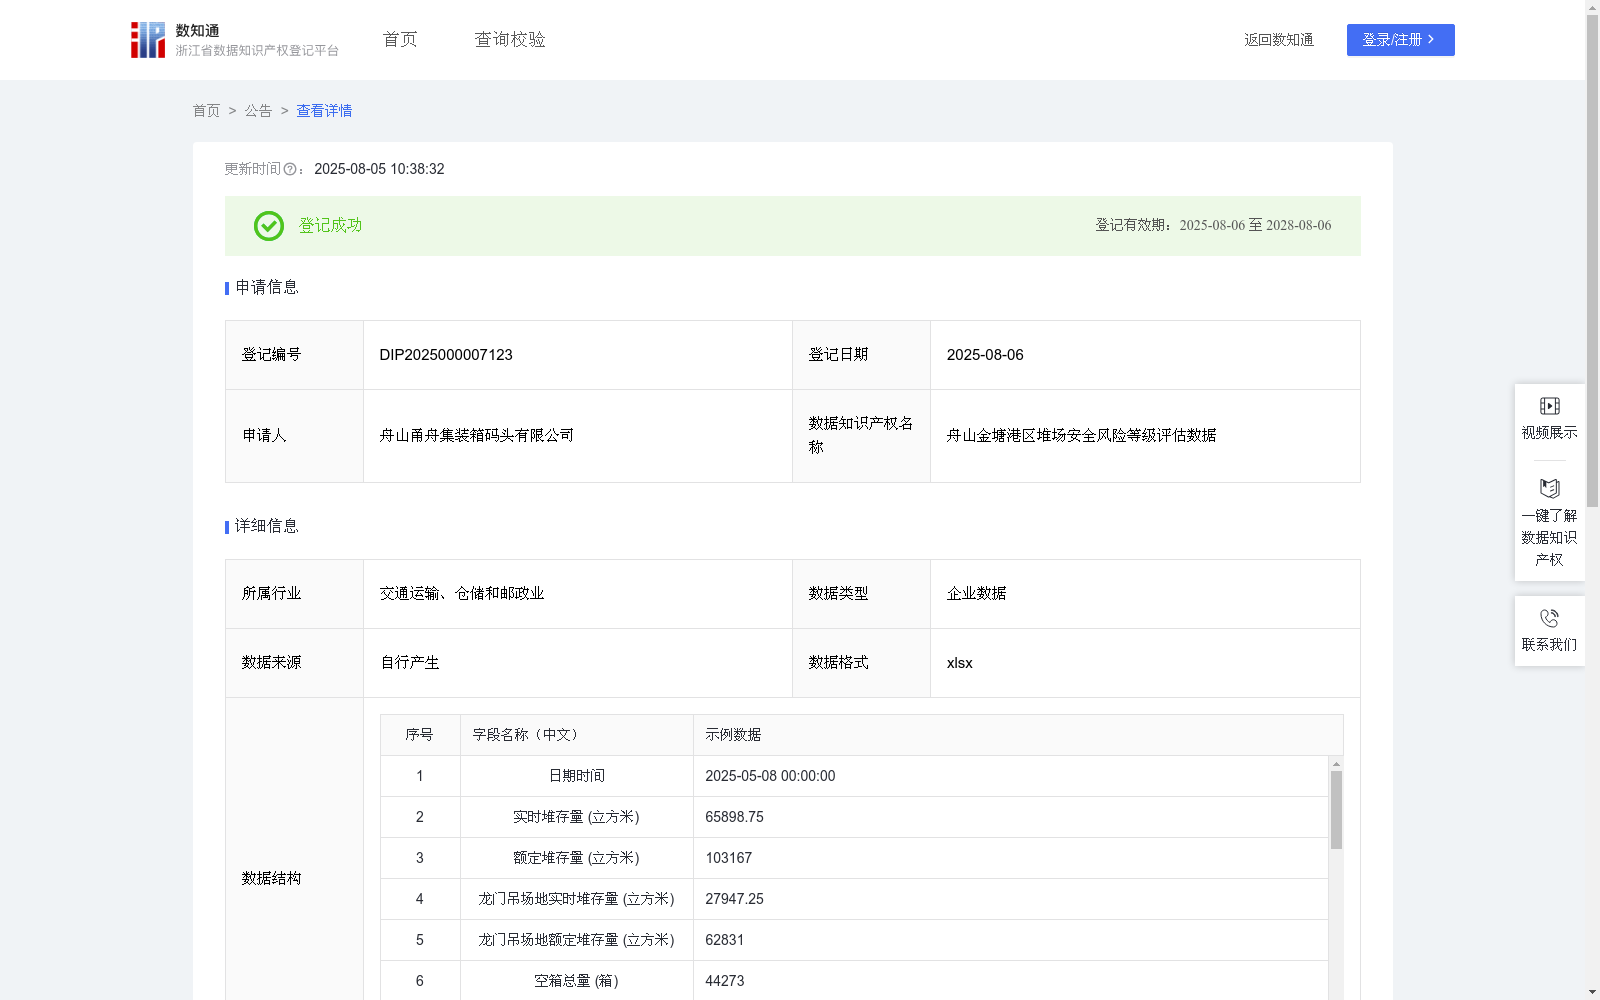
舟山金塘港区堆场安全风险等级评估数据
收藏资源简介:
通过对企业堆场安全风险进行量化评估,实时分析综合风险指数、核心区域压力、堆存率日变化及特殊箱型风险指数等关键指标,企业堆场计划与运营团队能够前瞻性地预判堆场拥堵与安全瓶颈。这使得企业能够动态调整堆场作业策略,优化场地资源分配,合理规划特殊箱型的落位与作业次序,有效降低因场地拥堵造成的无效翻倒柜作业和安全隐患,从而在有限的堆场空间内,最大化提升集装箱的周转处理能力。对于船公司与大型物流企业而言,这份实时的风险指数是预判港口拥堵、优化航线选择与运输计划的“晴雨表”,能帮助它们精准决策,是选择加速进港、减速等待还是临时转港,从而有效规避高昂的船舶滞期费用与燃油成本浪费。对于陆运拖车公司和货主,这意味着更透明、更可预期的提/还箱作业时间,使其能够合理安排车队调度、优化运输路线,进而保障下游工厂的生产计划与零售商的库存稳定。一、 数据采集与预处理 采集字段:日期时间、空箱总量、重箱总量、冷藏箱总量、危险箱总量、残损箱总量、超限箱总量、中转箱量、实时堆存量、额定堆存量、龙门吊场地实时堆存量、龙门吊场地额定堆存量。 二、 核心风险指标计算 全场堆存率(%) = (实时堆存量 / 额定堆存量) × 100; 日变化率(%) = [ (当日全场堆存率(%) - 前一日全场堆存率(%)) / 前一日全场堆存率(%) ] × 100; 总箱量 = 空箱总量 + 重箱总量 + 冷藏箱总量 + 危险箱总量 + 残损箱总量 + 超限箱总量 + 中转箱量; 特殊箱型加权数量= (危险箱总量 × W危) + (残损箱总量 × W残) + (超限箱总量 × W超) + (冷藏箱总量 × W冷),其中 W危=3, W残=2, W超=1, W冷=1。 特殊箱型风险指数(%) = (特殊箱型加权数量 / 总箱量) × 100; 容量压力系数 = 1 + |日变化率(%)| / 100; 容量压力指数 = 全场堆存率(%) × 容量压力系数; 综合风险指数 = (特殊箱型风险指数(%) × P特) + (容量压力指数 × P容),其中 P特=0.6, P容=0.4。 核心区域压力指数(%) = (龙门吊场地实时堆存量 / 龙门吊场地额定堆存量) × 100; 三、 风险等级判断规则 综合风险等级判断: 若 综合风险指数 < T1,则综合风险等级为"低风险",管理措施为"常规管理"。 若 T1 ≤ 综合风险指数 < T2,则综合风险等级为"中风险",管理措施为"加强监控"。 若 T2 ≤ 综合风险指数 < T3,则综合风险等级为"高风险",管理措施为"重点管控"。 若 综合风险指数 ≥ T3,则综合风险等级为"极高风险",管理措施为"紧急预案"。 注: T1=20, T2=40, T3=70。
By quantitatively assessing the safety risks of enterprise container yards and conducting real-time analysis of key indicators including comprehensive risk index, core area pressure, daily storage rate change, and special container risk index, the yard planning and operation teams can proactively predict yard congestion and safety bottlenecks. This enables enterprises to dynamically adjust yard operation strategies, optimize site resource allocation, rationally plan the placement and operational sequence of special containers, effectively reduce ineffective container rehandling operations and safety hazards caused by site congestion, and thus maximize container turnover and processing capacity within limited yard space. For shipping companies and large logistics enterprises, this real-time risk index serves as a barometer for predicting port congestion, optimizing route selection and transportation plans. It helps them make precise decisions on whether to accelerate port entry, slow down and wait, or temporarily divert to another port, thereby effectively avoiding expensive vessel detention fees and wasted fuel costs. For road transport trailer companies and cargo owners, this means more transparent and predictable container pick-up/return operation times, enabling them to reasonably arrange fleet scheduling, optimize transport routes, and thus ensure the stability of downstream factory production plans and retailer inventory levels. 1. Data Collection and Preprocessing Collection Fields: date and time, total number of empty containers, total number of loaded containers, total number of reefer containers, total number of dangerous goods containers, total number of damaged containers, total number of over-limit containers, volume of transit containers, real-time stock volume, rated stock volume, real-time stock volume of gantry crane yard, rated stock volume of gantry crane yard. 2. Core Risk Indicator Calculation Overall yard storage rate (%) = (Real-time stock volume / Rated stock volume) × 100; Daily change rate (%) = [(Today's overall yard storage rate (%) - Yesterday's overall yard storage rate (%)) / Yesterday's overall yard storage rate (%)] × 100; Total container volume = Total number of empty containers + Total number of loaded containers + Total number of reefer containers + Total number of dangerous goods containers + Total number of damaged containers + Total number of over-limit containers + Volume of transit containers; Weighted quantity of special containers = (Total number of dangerous goods containers × W_dangerous) + (Total number of damaged containers × W_damaged) + (Total number of over-limit containers × W_over-limit) + (Total number of reefer containers × W_reefer), where W_dangerous=3, W_damaged=2, W_over-limit=1, W_reefer=1; Special container risk index (%) = (Weighted quantity of special containers / Total container volume) × 100; Capacity pressure coefficient = 1 + |Daily change rate (%)| / 100; Capacity pressure index = Overall yard storage rate (%) × Capacity pressure coefficient; Comprehensive risk index = (Special container risk index (%) × P_special) + (Capacity pressure index × P_capacity), where P_special=0.6, P_capacity=0.4; Core area pressure index (%) = (Real-time stock volume of gantry crane yard / Rated stock volume of gantry crane yard) × 100; 3. Risk Level Judgment Rules Comprehensive risk level judgment: If Comprehensive risk index < T1, the comprehensive risk level is "Low Risk", and the management measure is "Routine Management". If T1 ≤ Comprehensive risk index < T2, the comprehensive risk level is "Medium Risk", and the management measure is "Enhanced Monitoring". If T2 ≤ Comprehensive risk index < T3, the comprehensive risk level is "High Risk", and the management measure is "Key Control". If Comprehensive risk index ≥ T3, the comprehensive risk level is "Extremely High Risk", and the management measure is "Emergency Plan". Note: T1=20, T2=40, T3=70.