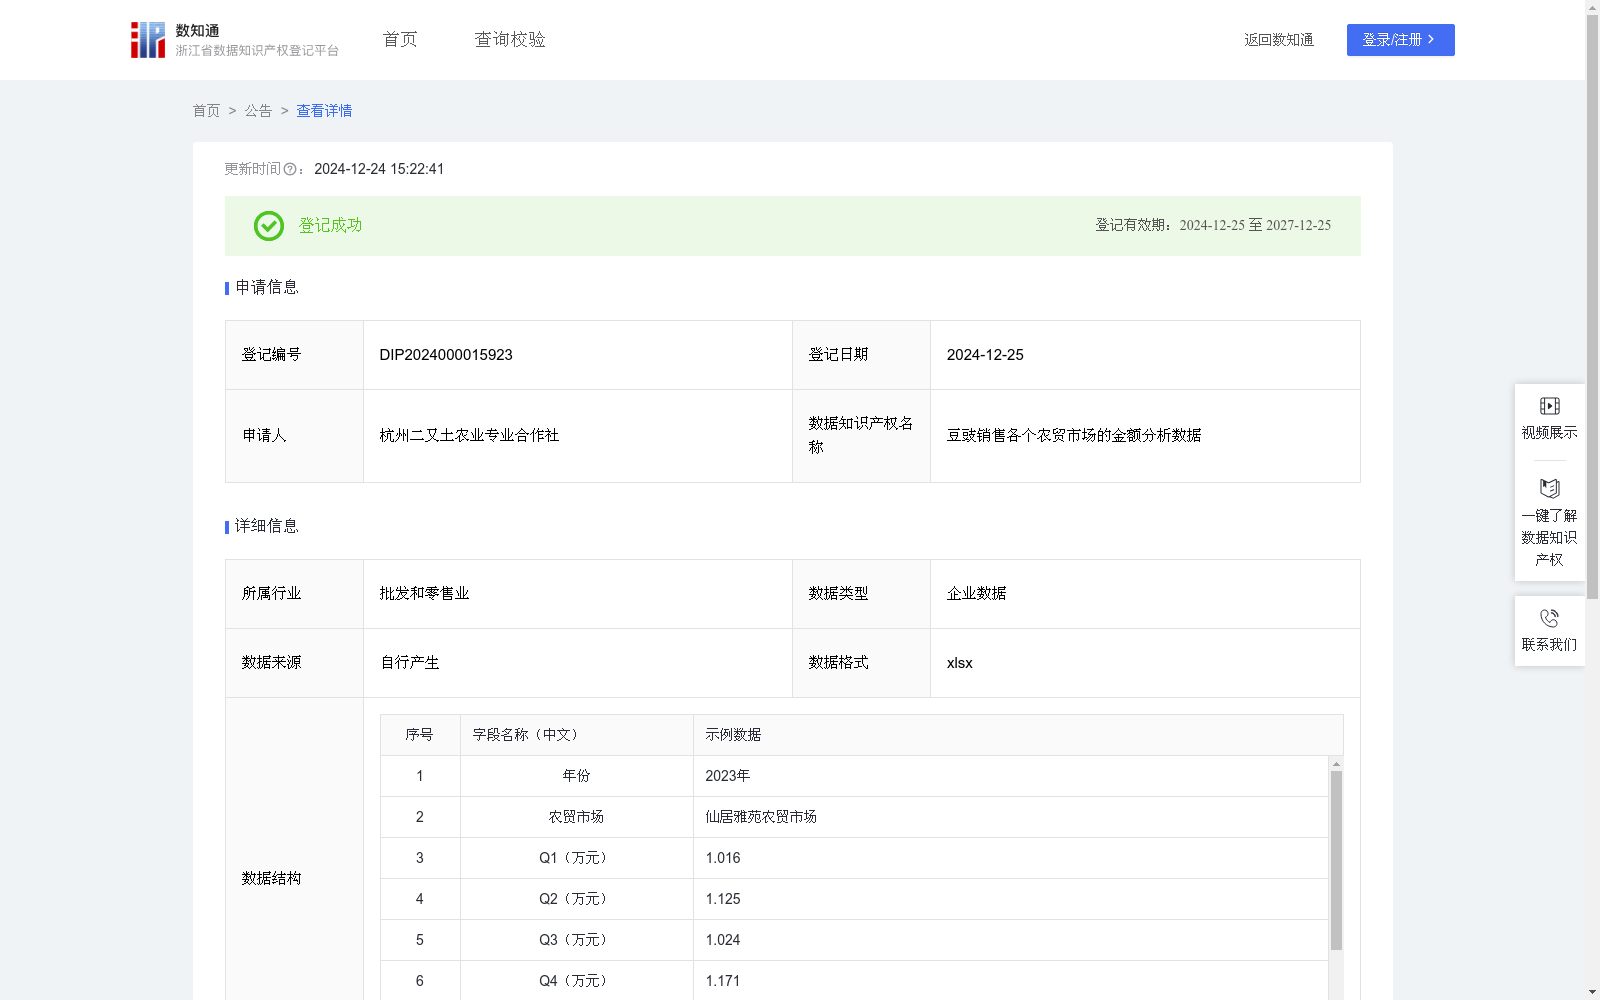
豆豉销售各个农贸市场的金额分析数据
收藏资源简介:
通过分析豆豉销售各个农贸市场的贸易稳定系数和贸易稳定级别,可广泛用于以下场景:1.评估产品销售:通过往年数据了解自身行业在各个农贸市场的淡旺季,以平衡生产和销售数量。2.了解市场:清晰地了解市场规模及其变化趋势,为制定市场进入策略和长期发展规划提供数据支持。3.指导战略决策:利用该数据来指导战略方向的制定。4.行业竞争策略:利用该数据了解和分析同行业产品销售数据信息,来衡量自身的市场竞争力,从而优化和调整企业策略,调整销售渠道布局,制定更加精准的营销策略。5.增强客户体验:使用数据来度量和改善产品的需求情况,为客户提供针对性的指导意见,从而提升客户满意度和忠诚度。本公司每年采集豆豉销售到各个农贸市场的四个季度销售额,依次分别为Q1、Q2、Q3和Q4,分析出每年度的季度平均销售额Q̅,Q̅=(Q1+Q2+Q3+Q4)/4,季度标准差S=√[{(Q1-Q̅)^2+(Q2-Q̅)^2+(Q3-Q̅)^2+(Q4-Q̅)^2}/4],利用贸易稳定系数φ来评价豆豉销售到该农贸市场的贸易稳定级别,φ=S/Q̅。当φ<0.1时,该农贸市场贸易稳定;当φ>0.15时,该农贸市场贸易不稳定;当0.1≤φ≤0.15时,该农贸市场贸易中等稳定。
By analyzing the trade stability coefficient and trade stability level of fermented soybean sales across various agricultural product markets, this dataset can be widely applied to the following scenarios: 1. Product sales assessment: Gain insights into the off-peak and peak sales seasons of one's own industry across different agricultural product markets using historical data, so as to balance production and sales volumes. 2. Market intelligence: Clearly understand the market scale and its changing trends, providing data support for formulating market entry strategies and long-term development plans. 3. Strategic decision-making guidance: Leverage this dataset to guide the formulation of strategic directions. 4. Industry competition strategy formulation: Utilize this dataset to understand and analyze the sales data of peer products, measure one's own market competitiveness, optimize and adjust corporate strategies, revise sales channel layouts, and develop more precise marketing strategies. 5. Customer experience enhancement: Use this dataset to measure and improve product demand conditions, provide targeted guidance for customers, and thereby improve customer satisfaction and loyalty. Our company collects quarterly sales data of fermented soybean products sold to various agricultural product markets annually, with the four quarters denoted as Q1, Q2, Q3 and Q4 respectively. The annual average quarterly sales Q-bar is calculated as Q-bar = (Q1 + Q2 + Q3 + Q4)/4, and the quarterly standard deviation S is calculated as S = sqrt([(Q1 - Q-bar)^2 + (Q2 - Q-bar)^2 + (Q3 - Q-bar)^2 + (Q4 - Q-bar)^2]/4). The trade stability coefficient phi is used to evaluate the trade stability level of fermented soybean sales in a given agricultural product market, where phi = S/Q-bar. Specifically, an agricultural product market is classified as having stable trade when phi < 0.1, unstable trade when phi > 0.15, and moderately stable trade when 0.1 <= phi <= 0.15.