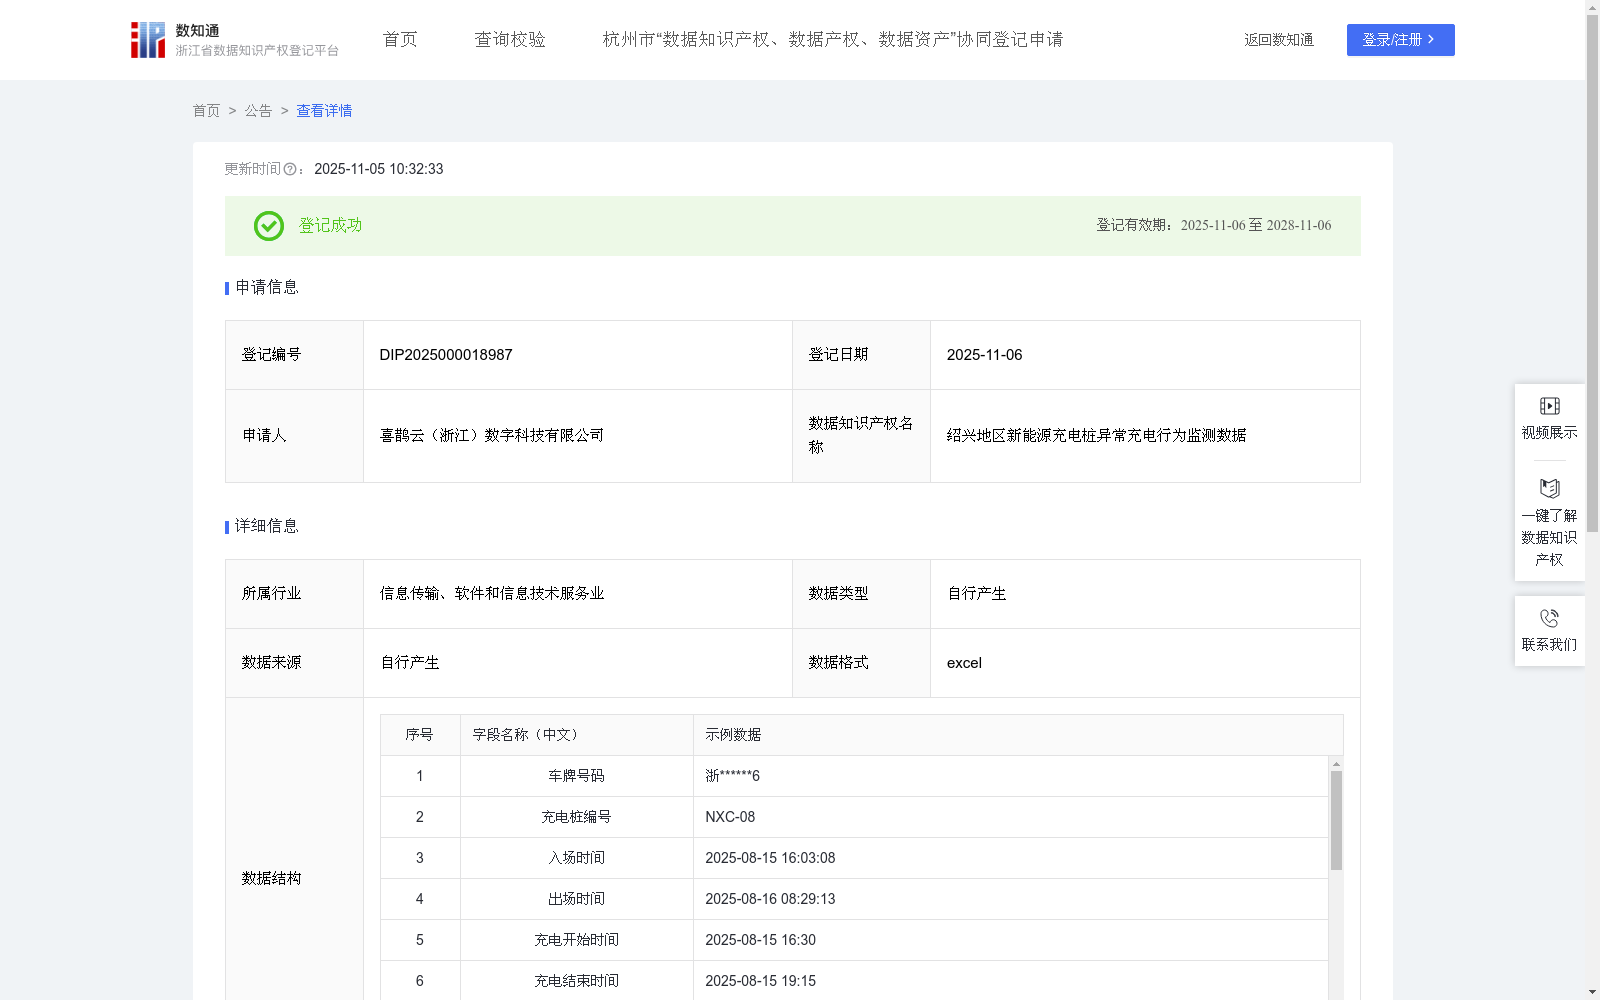
绍兴地区新能源充电桩异常充电行为监测数据
收藏资源简介:
该数据用于监控绍兴地区新能源充电桩的充电时长、电量及异常停留情况,帮助运营方发现长时间占用或异常行为的车辆。通过对每次充电行为进行智能分析和异常标记(如 w=1 表示超过合理充电时间或占位异常),可为后台管理提供智能报警和提醒机制。第三方运营方、物业管理和交通管理部门可利用此数据优化充电资源分配、提升用户充电公平性,并为后续统计分析提供高质量的数据基础。同时,该数据可结合用户类型(普通/会员)、历史充电次数等维度,生成个性化提醒或策略,改善充电桩使用体验并降低管理成本。1.数据采集:采集充电桩实时充电数据,包括入场出场时间、充电开始/结束时间、充电量、电费、用户类型及历史充电次数。 2.数据处理:计算每次充电的停车时长 T(出场时间减入场时间)、充电时长 C(充电结束时间减开始时间)、充电电量 E,并判定是否属于异常行为。 3.算法加工:对每次充电行为进行异常评估,异常优先级 P 计算公式如下: P = (0.40 × C/标准充电时长 S + 0.30 × E/平均充电量 M + 0.20 × h/平均历史充电次数 H + 0.10 × v_f) × s 公式说明:标准充电时长、平均充电量、平均历史充电次数均统计计算于2025/1/15-2025/7/15期间; C(充电时长)超过合理标准 S 时增加异常权重; E(充电电量)若远高于 M(区域平均充电量)视为潜在异常; h(历史充电次数)用于判定是否为高频用户,高频用户异常权重适度降低; v_f:用户类型加权因子(普通=1,会员=0.8); s:系统综合调节系数,用于调整异常检测灵敏度。此处取值s=0.75。 如果 P ≥ 0.7,则异常标记 w=1,否则 w=0。 4.数据分类分级:根据 P 值将充电行为划分为异常/正常两类,并对异常行为进行等级划分: 高异常(P ≥ 0.85):需立即报警与人工介入; 中异常(0.7 ≤ P < 0.85):系统自动提醒用户; 正常(P < 0.7):无异常处理,仅用于统计分析。
This dataset is utilized to monitor the charging duration, charged energy and abnormal parking status of new energy charging piles in Shaoxing, helping operators identify vehicles that occupy charging piles for an excessively long time or exhibit abnormal behaviors. Through intelligent analysis and abnormal labeling of each charging event (where w=1 indicates exceeding reasonable charging time or abnormal parking occupation), it can provide an intelligent alarm and reminder mechanism for background management. Third-party operators, property management departments and traffic management authorities can use this dataset to optimize the allocation of charging resources, improve the fairness of user charging, and provide a high-quality data foundation for subsequent statistical analysis. In addition, this dataset can be combined with dimensions such as user type (regular/member) and historical charging times to generate personalized reminders or strategies, thereby improving the charging experience and reducing management costs. 1. Data Collection: Collect real-time charging data of charging piles, including entry and exit time, charging start/end time, charged energy, electricity fee, user type and historical charging times. 2. Data Processing: Calculate the parking duration T (exit time minus entry time), charging duration C (charging end time minus charging start time) and charged energy E for each charging event, and determine whether the event belongs to abnormal behavior. 3. Algorithm Processing: Conduct abnormal evaluation for each charging event. The formula for the abnormal priority P is as follows: P = (0.40 × C/Standard Charging Duration S + 0.30 × E/Average Charged Energy M + 0.20 × h/Average Historical Charging Times H + 0.10 × v_f) × s Formula Explanation: The standard charging duration, average charged energy and average historical charging times are all statistically calculated during the period from 2025/1/15 to 2025/7/15. - When the charging duration C exceeds the reasonable standard S, the abnormal weight will increase; - If the charged energy E is much higher than the regional average charged energy M, it is regarded as a potential abnormality; - h (historical charging times) is used to determine whether the user is a high-frequency user, and the abnormal weight of high-frequency users will be appropriately reduced; - v_f: User type weighting factor (regular user = 1, member = 0.8); - s: System comprehensive adjustment coefficient, used to adjust the sensitivity of anomaly detection. The value here is s=0.75. If P ≥ 0.7, the abnormal label is set to w=1; otherwise, w=0. 4. Data Classification and Grading: Classify charging events into abnormal/normal categories based on the P value, and grade abnormal behaviors: - High-level anomaly (P ≥ 0.85): Immediate alarm and manual intervention are required; - Mid-level anomaly (0.7 ≤ P < 0.85): The system automatically reminds the user; - Normal (P < 0.7): No abnormal processing is required, only used for statistical analysis.