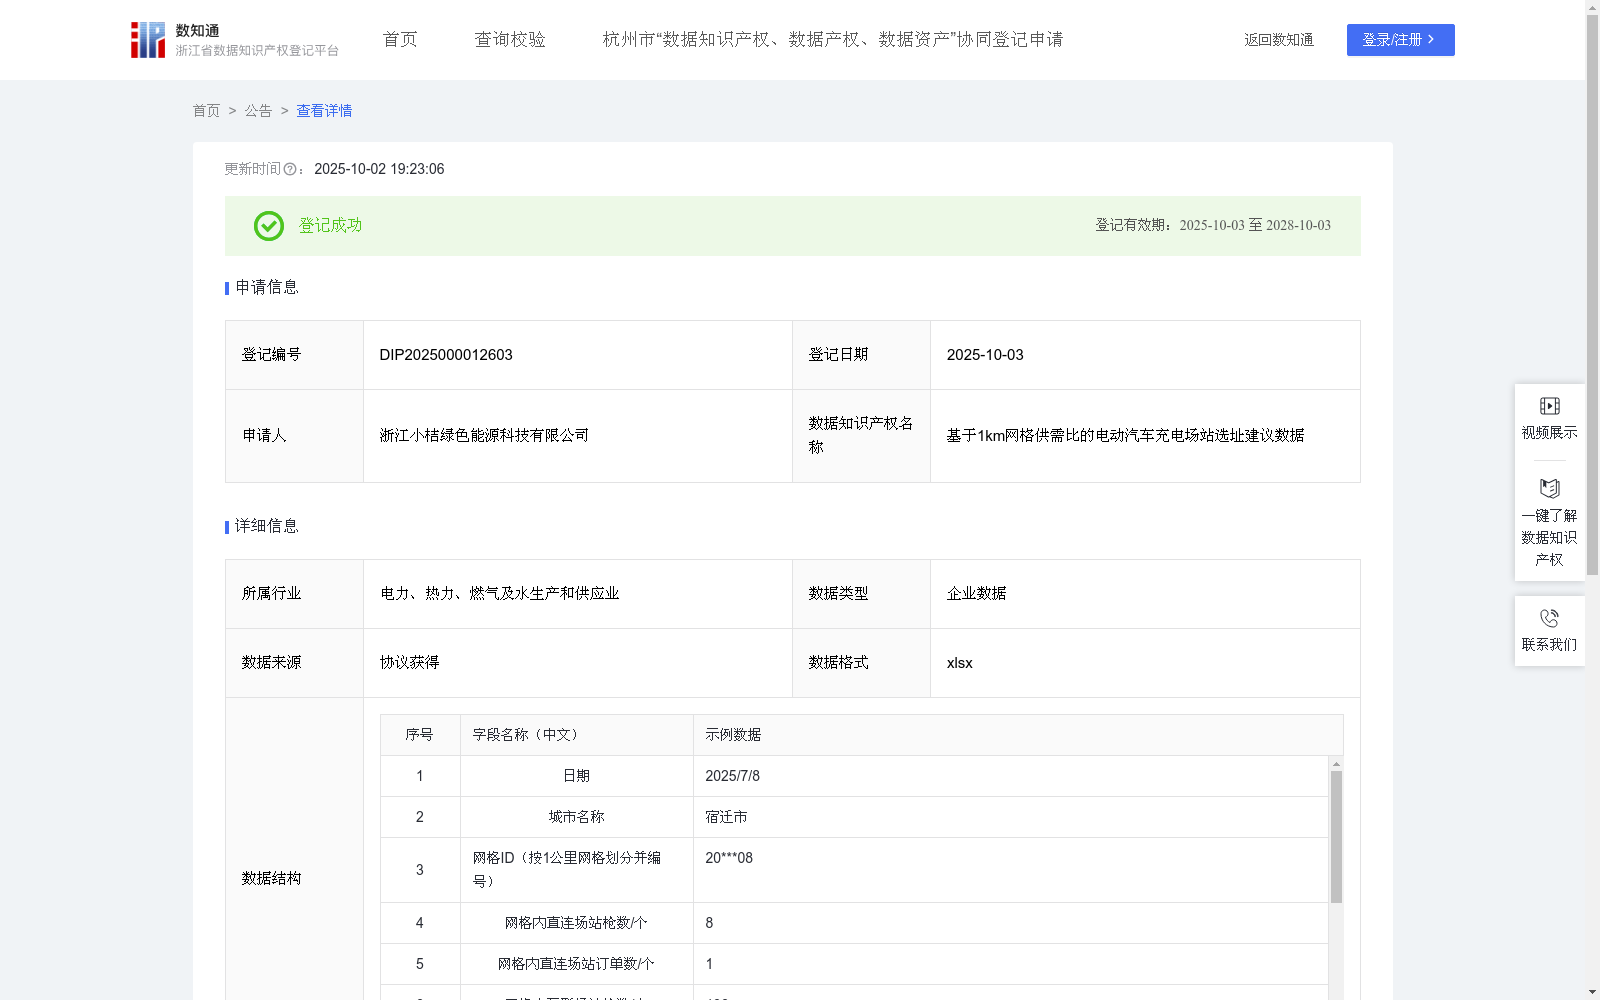
基于1km网格供需比的电动汽车充电场站选址建议数据
收藏资源简介:
本数据集在1km范围内构建高分辨率的供需比分析,给出精确的选址建议,并助力识别微观服务缺口、通勤拥堵点或生活圈空白区。具体应用场景如下: 1.对平台(即申请人)而言:可用于指导站点落位在精准缺口区域,提升局部调度与网络弹性; 2.对场站商家而言:可将供需比与具体使用场景(如居民区、学校、办公区等)结合,实现场景化运营落地; 3.对政府而言:可识别高负荷微区域,推动配电网能力配套或商业设施引导性建设。1.数据采集:原始数据经授权合法获取,包括日期、城市名称、网格ID(按1公里网格划分并编号)、网格内直连场站枪数、网格内直连场站订单数、网格内互联场站枪数、网格内互联预测订单数、网格内外部场站枪数等字段。 2.网格内供需指标计算:(1)网格内预测充电订单数S=网格内直连场站订单数+网格内互联预测订单数+网格内外部场站枪数×0.7;(2)网格内充电枪数D=网格内直连场站枪数+网格内互联场站枪数+网格内外部场站枪数。 3.建立基于1km网格供需比的选址评估模型:(1)计算供需比(S/D):供需比=网格内预测充电订单数÷网格内充电枪数;(2)选址评估分类和建议:若S/D≤0.5,则为“低效冗余型”,建议“暂停新建”,若0.5<S/D≤1.0,则为“份额领先型”,建议“维持现状”,若1.0<S/D≤1.5,则为“潜力平衡型”,建议“轻量补足”,若S/D>1.5,则为“在建供给型”,建议“加大建设”。
This dataset constructs high-resolution supply-demand ratio analysis within a 1km range, provides precise site selection recommendations, and assists in identifying microscopic service gaps, commuting congestion points, or blank areas in living circles. The specific application scenarios are as follows: 1. For platforms (i.e., applicants): It can be used to guide the placement of stations in precisely identified gap areas, improving local dispatching and network resilience; 2. For station operators: It can combine the supply-demand ratio with specific usage scenarios (such as residential areas, schools, office areas, etc.) to achieve scenario-based operational implementation; 3. For governments: It can identify high-load micro-areas, and promote supporting construction of power distribution network capacity or guided construction of commercial facilities. 1. Data Collection: The raw data is legally obtained with authorization, including fields such as date, city name, grid ID (divided and numbered according to 1km grids), number of direct charging station ports within the grid, number of direct station orders within the grid, number of interconnected station ports within the grid, number of interconnected predicted orders within the grid, and number of external station ports within the grid. 2. Supply and Demand Index Calculation within the Grid: (1) Predicted charging order volume S within the grid = number of direct station orders within the grid + number of interconnected predicted orders within the grid + number of external station ports within the grid × 0.7; (2) Number of charging ports D within the grid = number of direct station ports within the grid + number of interconnected station ports within the grid + number of external station ports within the grid. 3. Establishment of a Site Selection Evaluation Model Based on 1km Grid Supply-Demand Ratio: (1) Calculate the supply-demand ratio (S/D): Supply-demand ratio = predicted charging order volume within the grid ÷ number of charging ports within the grid; (2) Site selection evaluation classification and recommendations: If S/D ≤ 0.5, it is classified as "Inefficient Redundancy Type" with the recommendation of "Suspend New Construction"; if 0.5 < S/D ≤ 1.0, it is classified as "Market Share Leading Type" with the recommendation of "Maintain Status Quo"; if 1.0 < S/D ≤ 1.5, it is classified as "Potential Balance Type" with the recommendation of "Lightly Supplement"; if S/D > 1.5, it is classified as "Under Construction Supply Type" with the recommendation of "Increase Construction".