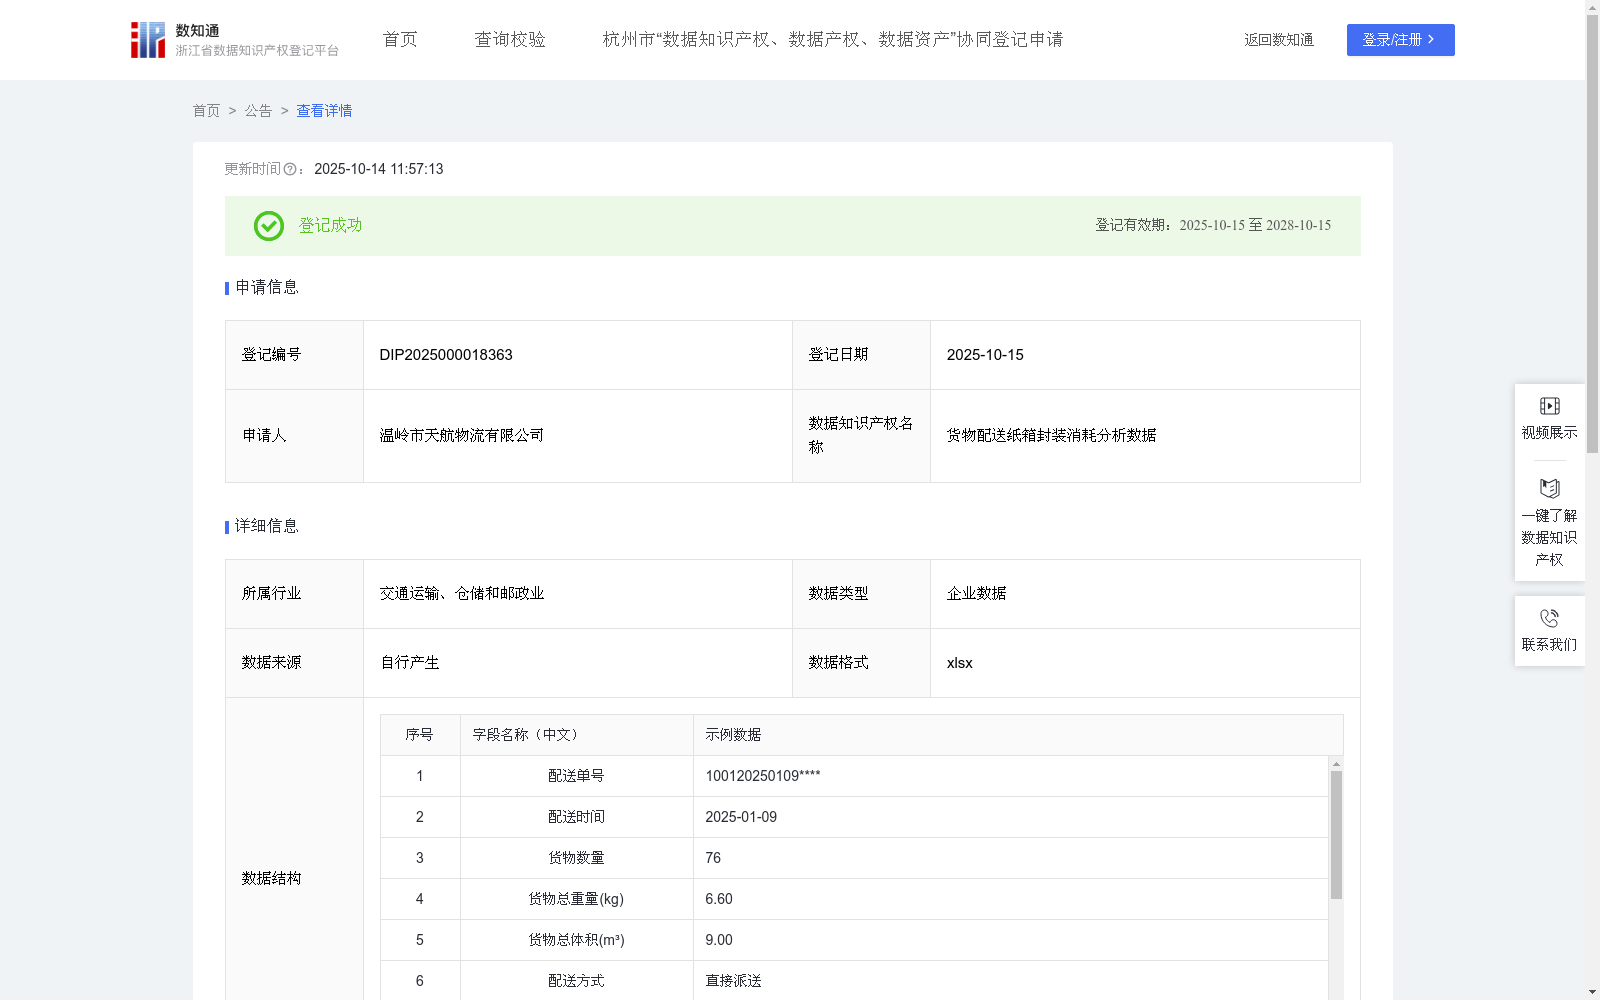
货物配送纸箱封装消耗分析数据
收藏资源简介:
在货仓货物打包过程中,会产生各类封装材料的消耗。针对纸箱这一封装材料,通过环比分析其消耗数据,能够判断出消耗的环比增长趋势及具体状态。基于算法分析所得结果,能够精准捕捉消耗波动的规律与趋势,从而形成更具前瞻性的应对策略。通过对数据的深度解读,不仅可以提前预判纸箱的消耗节奏,还能根据实际需求动态调整储备量,从根本上减少因物料短缺造成的封装中断风险。如此一来,既实现了对消耗波动的精细化管控,也让整个封装环节的流程衔接更加顺畅,显著提升了货仓打包工作的稳定性与效率,为后续的货物流转提供了坚实保障。1. 数据收集:通过对2024年6月-2025年6月的订单数据进行统计收集整理、归类和清洗等操作,获得原始数据表单,得到原始数据字段:配送单号、配送时间、货物数量、货物总重量、货物总体积、配送方式、封装类型、纸箱消耗数量和消耗月份。 2. 数据处理:使用收集得到的原始数据,结合下面的算法公式得到分析后的数据: 本月消耗纸箱数量为本月所有封装类型为纸箱的订单消耗的数量相加获得;上月消耗纸箱数量为上月所有封装类型为纸箱的订单消耗的数量相加获得。 环比增长率 = ((本月消耗纸箱数量 - 上月消耗纸箱数量) / 上月消耗纸箱数量 ) * 100% 环比增长趋势判定规则为:环比增长率<0 时为下降,=0 时为持平,>0 时为上升。 | 环比增长率 | > 50% 时为红色警告,<30% 时为正常; 30% ≤ |环比增长率| ≤ 50%时,环比增长率状态为黄色警告; 3. 数据分析:当环比增长趋势呈现上升态势时,意味着纸箱的消耗需求在增加,未来一个月的准备数量可在本月消耗基础上适当上调;若趋势为下降,说明消耗需求有所减少,准备数量则可相应下调;而趋势持平时,准备数量可参考本月消耗情况保持稳定。 在储备量动态调整方面,当环比增长率状态为 “正常”(| 环比增长率 |<30%)时,表明纸箱消耗的波动处于合理范围内,此时可结合实际订单量的变化,灵活、动态地调整储备量,以确保储备既能满足日常配送需求,又不会造成过度积压。 环比增长率状态为 “黄色警告”(30%≤| 环比增长率 |≤50%)时,说明纸箱消耗出现了一定程度的波动,虽未达到严重异常,但仍需加以关注。可对近期订单结构、配送需求等进行初步分析,判断波动是否由短期因素引起,再根据分析结果适度调整储备策略,提前做好应对可能出现的需求变化的准备。 环比增长率状态为 “红色警告”(| 环比增长率 |>50%),则表示纸箱消耗波动过大,需要对异常数据进行深入且细致的分析。例如,分析本月是否有大型促销活动导致订单量激增,进而使纸箱消耗大幅增加;或者排查是否存在封装操作不当、统计失误等问题导致数据异常。在明确具体原因后,再制定针对性的储备策略,以保证纸箱的储备既精准又高效,避免因异常波动而出现储备不足或浪费的情况。
In the process of warehouse cargo packaging, various packaging materials are consumed. For cartons as a key packaging material, conducting month-on-month (MoM) analysis of their consumption data can help identify the MoM growth trend and specific status of consumption. Based on the results derived from algorithmic analysis, the patterns and trends of consumption fluctuations can be accurately captured, enabling the formulation of more forward-looking response strategies. Through in-depth interpretation of the data, not only can the carton consumption rhythm be predicted in advance, but the inventory reserve can also be dynamically adjusted according to actual demands, fundamentally reducing the risk of packaging interruptions caused by material shortages. This not only realizes refined control over consumption fluctuations but also ensures smoother process coordination in the entire packaging link, significantly improving the stability and efficiency of warehouse packaging operations and providing a solid guarantee for subsequent cargo circulation. 1. Data Collection: From June 2024 to June 2025, order data was statistically collected, sorted, categorized and cleaned to obtain the original data sheet, with the following original data fields: delivery order number, delivery time, cargo quantity, total cargo weight, total cargo volume, delivery method, packaging type, carton consumption quantity, and consumption month. 2. Data Processing: Using the collected original data, analyzed data was obtained with the following algorithmic formulas: - Current month carton consumption: Sum of carton consumption quantities for all orders with packaging type set as "carton" in the current month. - Last month carton consumption: Sum of carton consumption quantities for all orders with packaging type set as "carton" in the previous month. - Month-on-month growth rate = ((Current month carton consumption - Last month carton consumption) / Last month carton consumption) * 100% - Month-on-month growth trend determination rules: When the growth rate is < 0, the trend is downward; when equal to 0, the trend is flat; when > 0, the trend is upward. - Alert status rules: - |Month-on-month growth rate| > 50% → Red Alert - |Month-on-month growth rate| < 30% → Normal Status - 30% ≤ |Month-on-month growth rate| ≤ 50% → Yellow Alert 3. Data Analysis: When the month-on-month growth trend is upward, it means the demand for cartons is increasing, and the reserve quantity for the next month can be appropriately increased based on the current month's consumption. If the trend is downward, the demand has decreased, so the reserve quantity can be adjusted down accordingly; if the trend is flat, the reserve quantity can be maintained stable referring to the current month's consumption. For dynamic reserve adjustment: - When the growth rate status is "Normal" (|growth rate| < 30%): The fluctuation of carton consumption is within a reasonable range. At this time, the reserve can be flexibly and dynamically adjusted based on changes in actual order volume to ensure that the reserve meets daily delivery demands without excessive overstock. - When the growth rate status is "Yellow Alert" (30% ≤ |growth rate| ≤ 50%): Certain fluctuations in carton consumption have occurred, which are not severely abnormal but require attention. A preliminary analysis of recent order structures, delivery demands, etc., can be conducted to determine whether the fluctuations are caused by short-term factors, and the reserve strategy can be moderately adjusted based on the analysis results to prepare for potential demand changes in advance. - When the growth rate status is "Red Alert" (|growth rate| > 50%): It indicates excessive fluctuations in carton consumption, and in-depth and detailed analysis of abnormal data is required. For example, analyze whether this month's order surge caused by large-scale promotional activities led to a sharp increase in carton consumption, or check for issues such as improper packaging operations or statistical errors that caused abnormal data. After clarifying the specific causes, targeted reserve strategies should be formulated to ensure accurate and efficient carton reserves, avoiding reserve shortages or waste caused by abnormal fluctuations.