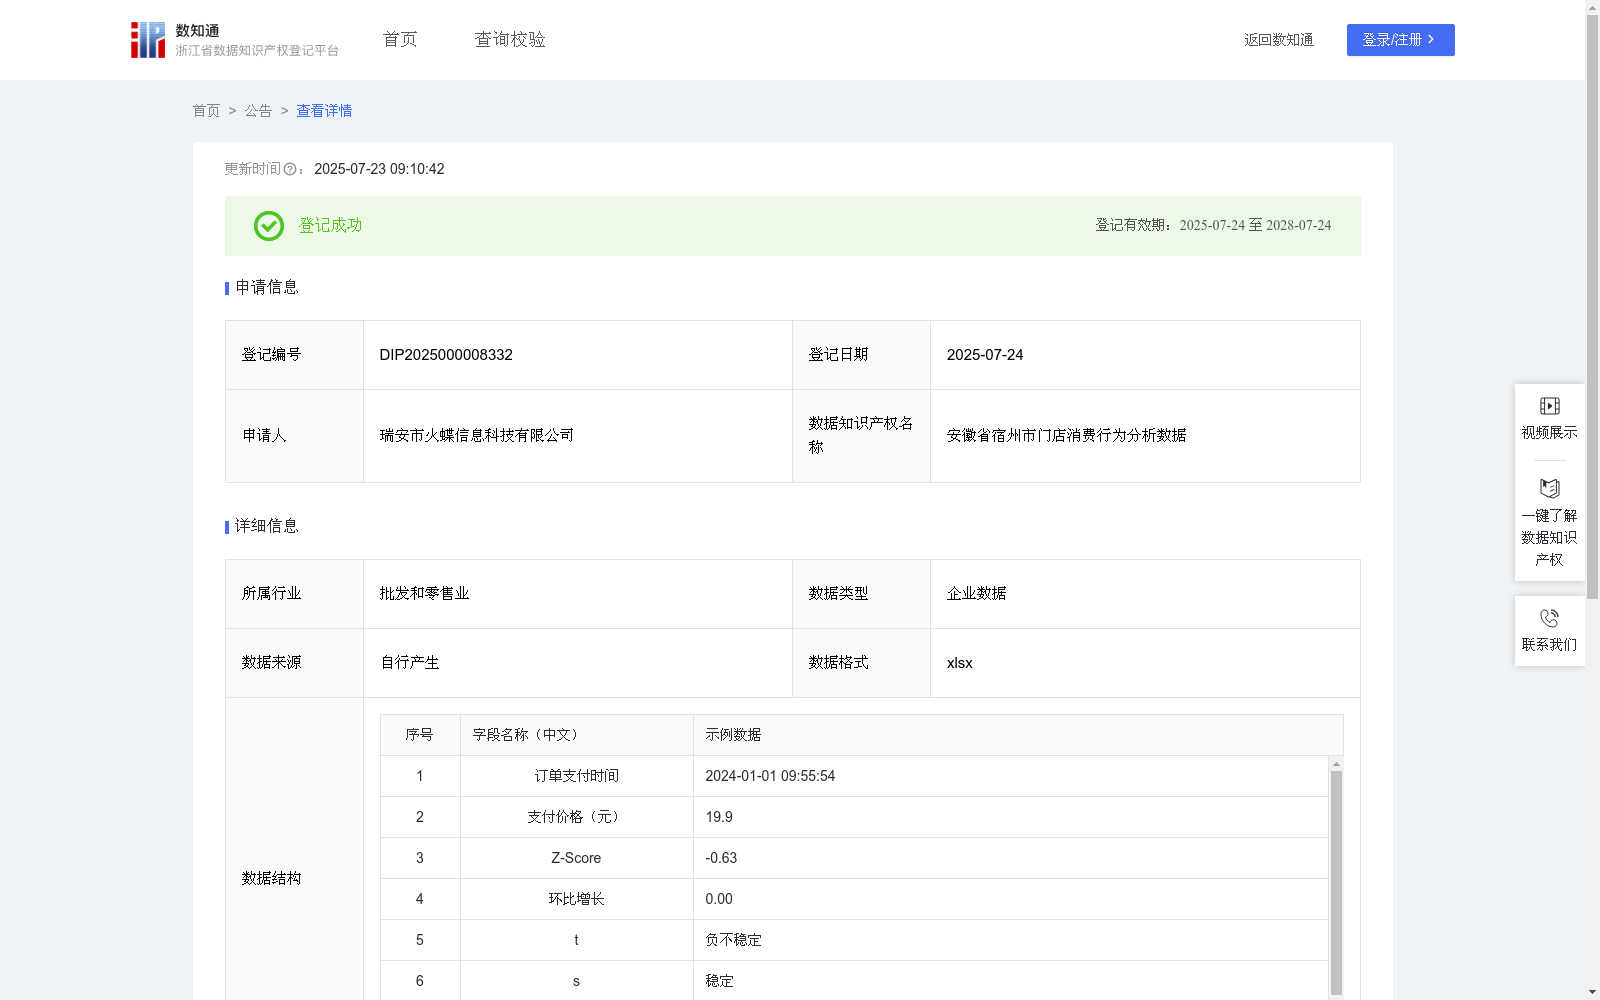
安徽省宿州市门店消费行为分析数据
收藏资源简介:
通过分析各个销售订单的Z-Score可以得到在这2024年第一季度的用户在线下实体门店消费行为的稳定性变化,用于合理预测门店所在区域的消费趋势的走向,优化区域发展战略布局。2.建立科学的战略决策模型。企业可通过分析环比增长数据变化可以得到2024年第一季度的区间峰值时间,例如建立s评分-时间图像,当出现s评分增长或s评分密集的时间段,可认为这一时间段为峰值时间,并通过数据构建仓储补货体系,合理完成补货避免因为备货不足错过销售高峰期。3.通过t(评分系统)和s(评分系统)的综合分析可以能够制定针对性的渠道优化方案和营销策略,提升整体市场竞争力数据采集:分区域读取数据库中每笔交易订单支付时间和支付价格。相同时间的订单以数据库内生成前后顺序排序。 Z-Score:通过计算单笔订单的支付价格与整体均值的差值再除以总体标准差得到Z-Score。环比增长:通过计算当前订单支付价格与前一笔订单的比值减1获得(当首行或者无前序数据返回空值)。t和 s为评分系统,当Z-Score>0.2时t为正不稳定,当0.2≥Z-Score≥-0.2时t为稳定,当Z-Score<-0.2时t为负不稳定。当环比增长>0则s=增大,当环比增长=0时 s=稳定,当s<0时s=减小。峰值区间说明:由于s是基于前一条订单做出的判断, 当前时间的s处于增加而后一条订单的s处于减少的时候则当前订单数据为区间内峰值。
Analyzing the Z-Score of each sales order enables deriving the stability changes of consumers' offline shopping behaviors in Q1 2024, which supports the reasonable prediction of regional consumption trends and optimization of regional development strategic layouts. 2. Establish a scientific strategic decision-making model. Enterprises can identify the interval peak times in Q1 2024 by analyzing month-on-month growth data changes. For example, by constructing an S-score vs. time graph, time periods with increasing S-scores or dense S-score values can be identified as peak periods. Enterprises can then build a warehouse restocking system based on the data to reasonably arrange restocking and avoid missing sales peaks due to insufficient stock preparation. 3. Comprehensive analysis of the t (scoring system) and s (scoring system) enables the formulation of targeted channel optimization plans and marketing strategies, thereby enhancing overall market competitiveness. Data Collection: Read the payment time and payment amount of each transaction order in the database by region. Orders placed at the same time are sorted according to their generation sequence within the database. Z-Score: The Z-Score is calculated by dividing the difference between the payment amount of a single order and the overall mean by the population standard deviation. Month-on-Month Growth: Calculated as the ratio of the payment amount of the current order to that of the previous order minus 1 (return a null value if it is the first row or no preceding data exists). t and s Scoring Systems: t and s are two scoring systems defined as follows: - For the t score: it is categorized as positively unstable when Z-Score > 0.2, stable when 0.2 ≥ Z-Score ≥ -0.2, and negatively unstable when Z-Score < -0.2. - For the s score: it is marked as "increasing" when month-on-month growth > 0, "stable" when month-on-month growth = 0, and "decreasing" when month-on-month growth < 0. Peak Interval Explanation: Since the s score is determined based on the previous order, the current order's data is considered the peak within the interval when the s score of the current time is "increasing" and the s score of the subsequent order is "decreasing".