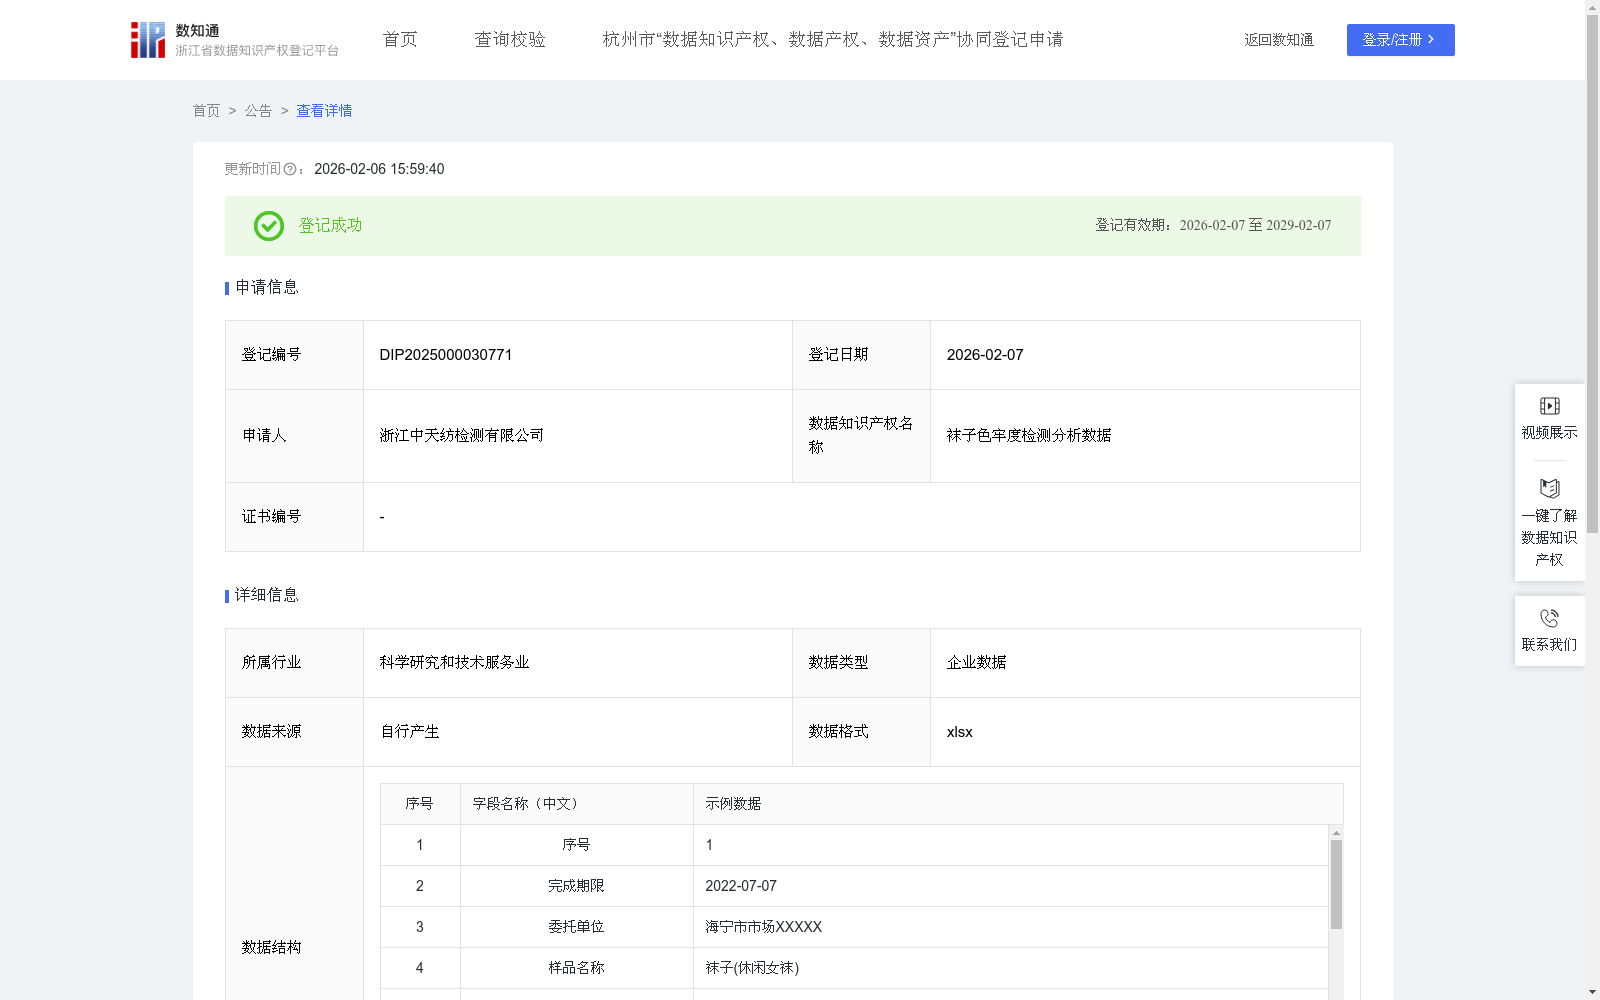
袜子色牢度检测分析数据
收藏资源简介:
行业内企业可根据近三年海宁及周边企业送检的袜子色牢度检测数据,确定本公司袜子产品色牢度行业内横向比较质量控制水平,若袜子综合色牢度指数CCI值小于等于μ-1.5σ,则说明袜子色牢度综合水平较低,有较大提升空间;处于行业均值区间(μ-1.5σ<CCI≤μ+0.5σ),表明色牢度控制达到行业平均水平;若CCI值处于优质稳定区间(μ+0.5σ<CCI≤μ+0.9σ),代表袜子色牢度优质稳定,产品较优,有良好的市场竞争力;若CCI值>μ+0.9σ,则袜子色牢度十分优秀,行业顶尖,可设为内部质量标杆。在生产端,企业可以根据袜子CCI值为制定质量管理控制和绩效考核目标提供依据,以最优区间为标杆,通过优化原料来源以及生产工艺,提升袜子穿着性能,以抢占高端市场。采购商则利用区间对供应商进行精准分级,优先选择CCI值高的优质供应商,同时通过价格谈判控制成本,实现性价比最大化。监管部门则根据行业数据动态调整评价区间,推动标准升级,并通过认证与激励政策引导企业向高性能、可持续方向发展,最终实现全链条的质量提升与市场规范化。1、数据来源于近3年海宁及周边企业送检的袜子根据国标检测的色牢度数据,耐皂洗色牢度CS、耐水色牢度CW、耐汗渍色牢度(酸液)CA、耐汗渍色牢度(碱液)CB、耐干摩擦色牢度CD、耐湿摩擦色牢度CF;根据不同类型色牢度对袜子穿着体验的影响程度,确定权重系数,WS=0.25、WW=0.15、WA=0.15、WB=0.1、WD=0.15、WF=0.2。 2、收集全行业样本的色牢度值,找出每种色牢度数据的最大值,例如CSmax=4.5;最小值,例如CSmin=2.0;平均值,例如CS'=4.05;根据公式计算修正值,例如,耐皂洗色牢度修正值CCS=100(CS-CS')/(CSmax-CSmin)。 3、计算出各类色牢度的修正值后,利用公式计算综合色牢度指数CCI,CCI=WS*CCS+WW*CCW+WA*CCA+WB*CCB+WD*CCD+WF*CCF。 4、收集全行业样本的CCI值,计算均值μ、标准差σ。 5、区间修正:色牢度水平较低CCI≤μ-1.5σ;行业均值μ-1.5σ<CCI≤μ+0.5σ;优质稳定μ+0.5σ<CCI≤μ+0.9σ;行业标杆μ+0.9σ<CCI。
Enterprises in the industry can benchmark their quality control level of sock color fastness against the industry based on the color fastness test data of socks submitted for inspection by enterprises in Haining and its surrounding areas over the past three years. Specifically, if the Comprehensive Color Fastness Index (CCI) value of a sock is ≤ μ-1.5σ, it indicates that the overall color fastness level of the sock is relatively low with considerable room for improvement; if the CCI value falls within the industry average range (μ-1.5σ < CCI ≤ μ+0.5σ), the color fastness control meets the industry average level; if the CCI value is in the high-quality and stable range (μ+0.5σ < CCI ≤ μ+0.9σ), the sock's color fastness is high-quality and stable, with superior products and strong market competitiveness; if the CCI value > μ+0.9σ, the sock's color fastness is extremely excellent, top-tier in the industry, and can be set as an internal quality benchmark. In terms of production, enterprises can use sock CCI values as a basis for formulating quality management control and performance assessment targets. Taking the optimal interval as the benchmark, they can optimize raw material sources and production processes to improve the wearing performance of socks and seize the high-end market. For purchasers, they can use these intervals to accurately classify suppliers, prioritize high-quality suppliers with high CCI values, and control costs through price negotiations to maximize cost-effectiveness. Regulatory authorities can dynamically adjust the evaluation intervals based on industry data, promote standard upgrades, and guide enterprises towards high-performance and sustainable development through certification and incentive policies, ultimately achieving full-chain quality improvement and market standardization. 1. The data is sourced from color fastness test data of socks tested according to national standards (GB) submitted for inspection by enterprises in Haining and its surrounding areas over the past three years, including color fastness to washing (CS), color fastness to water (CW), color fastness to perspiration (acidic solution, CA), color fastness to perspiration (alkaline solution, CB), color fastness to dry rubbing (CD), and color fastness to wet rubbing (CF). The weight coefficients are determined based on the impact of different types of color fastness on the wearing experience of socks: WS=0.25, WW=0.15, WA=0.15, WB=0.1, WD=0.15, WF=0.2. 2. Collect the color fastness values of all industry samples, and calculate the maximum value (e.g., CSmax=4.5), minimum value (e.g., CSmin=2.0), and mean value (e.g., CS'=4.05) for each type of color fastness data. Calculate the corrected value using the formula: for example, the corrected value of color fastness to washing CCS = 100×(CS - CS')/(CSmax - CSmin). 3. After calculating the corrected values for each type of color fastness, calculate the Comprehensive Color Fastness Index (CCI) using the formula: CCI = WS×CCS + WW×CCW + WA×CCA + WB×CCB + WD×CCD + WF×CCF. 4. Collect the CCI values of all industry samples, and calculate the mean value μ and standard deviation σ. 5. Interval classification: Low color fastness level: CCI ≤ μ-1.5σ; Industry average level: μ-1.5σ < CCI ≤ μ+0.5σ; High-quality and stable level: μ+0.5σ < CCI ≤ μ+0.9σ; Industry benchmark level: CCI > μ+0.9σ.