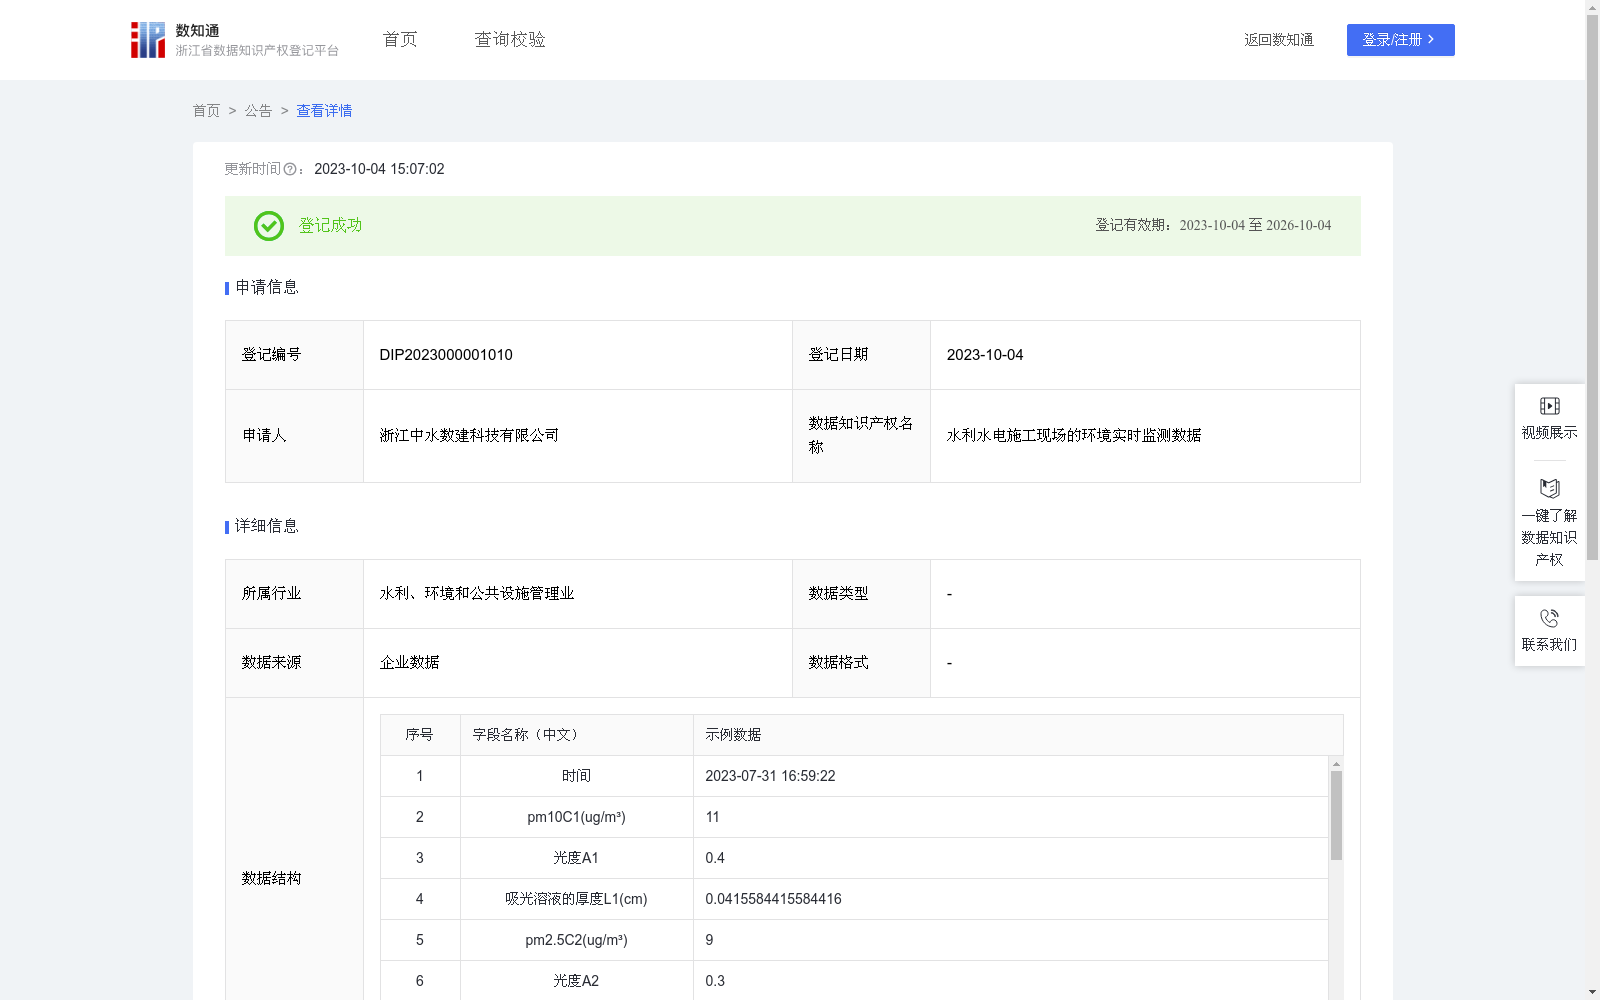
水利水电施工现场的环境实时监测数据
收藏资源简介:
通过采集施工现场的PM值、风速、湿度、温度、噪声、总悬浮颗粒物TSP等数据,实时分析施工现场的噪声、PM值、TSP等超标值,并进行报警和统计;同时按天、月、年等时间维度对不同参数进行趋势分析,形成数据分析报表,为后期数据决策提供支撑。1. 数据来源 通过采集施工现场的PM值、风速、湿度、温度、噪声、总悬浮颗粒物TSP等数据; 2. 数据处理 在监控系统中设置PM2.5、PM10、风速、湿度、温度、噪声、TSP等不同参数预警值,其中湿度、温度、噪声是直接采集获得的,其它参数通过以下公式分析: (1)风速υ υ^2γ=2λ/R,其中γ为空气重度,R为摩阻,λ为摩阻系数,可取0.09; (2)施工现场的PM2.5、PM10、TSP浓度 PM10浓度:C1=A1/(ε*L1),PM2.5浓度:C2=A2/(ε*L2),TSP浓度C3=A3/(ε*L3), 其中ε为摩尔吸光系数,L1、L2和L3分别为对应参数PM10、PM2.5、TSP吸光溶液的厚度,C1、C2和C3分别为对应参数PM10、PM2.5、TSP的光度; 3. 数据应用 采用多通道实时独立对比方法,将对应参数预警值与实时采集数据进行对比分析,对超幅度进行预警或限位;同时监控系统对采集的多通道数据进行储存、检测,按天、周、月等时间维度进行趋势分析,形成数据分析报表,为后期数据决策提高支撑。
This dataset collects data including PM concentrations, wind speed, humidity, temperature, noise, and Total Suspended Particulates (TSP) at construction sites, conducts real-time analysis of exceeding threshold values of noise, PM concentrations, TSP and other relevant parameters at construction sites, and performs alarming and statistics; meanwhile, it carries out trend analysis of different parameters across time dimensions such as daily, monthly and yearly, and generates data analysis reports to provide support for subsequent data-driven decision-making. 1. Data Source Data is collected from construction sites, including PM concentrations, wind speed, humidity, temperature, noise, and Total Suspended Particulates (TSP). 2. Data Processing Early warning thresholds for various parameters including PM2.5, PM10, wind speed, humidity, temperature, noise and TSP are set in the monitoring system. Among them, humidity, temperature and noise are directly collected, while other parameters are analyzed via the following formulas: (1) Wind speed υ: $υ^2γ = 2λ/R$, where γ is the air specific weight, R is the friction resistance, and λ is the friction coefficient, which can be set to 0.09; (2) Concentrations of PM2.5, PM10 and TSP at construction sites: PM10 concentration: $C_1 = A_1/(ε·L_1)$, PM2.5 concentration: $C_2 = A_2/(ε·L_2)$, TSP concentration: $C_3 = A_3/(ε·L_3)$, where ε is the molar absorption coefficient, $L_1, L_2$ and $L_3$ are the thicknesses of the absorption solutions corresponding to PM10, PM2.5 and TSP respectively, and $C_1, C_2$ and $C_3$ are the absorbances of PM10, PM2.5 and TSP respectively. 3. Data Application The multi-channel real-time independent comparison method is adopted to compare and analyze the real-time collected data with the early warning thresholds of corresponding parameters, and issue early warnings or set limit values for over-standard ranges. Meanwhile, the monitoring system stores and detects the collected multi-channel data, conducts trend analysis across time dimensions such as daily, weekly and monthly, and generates data analysis reports to provide support for subsequent data-driven decision-making.