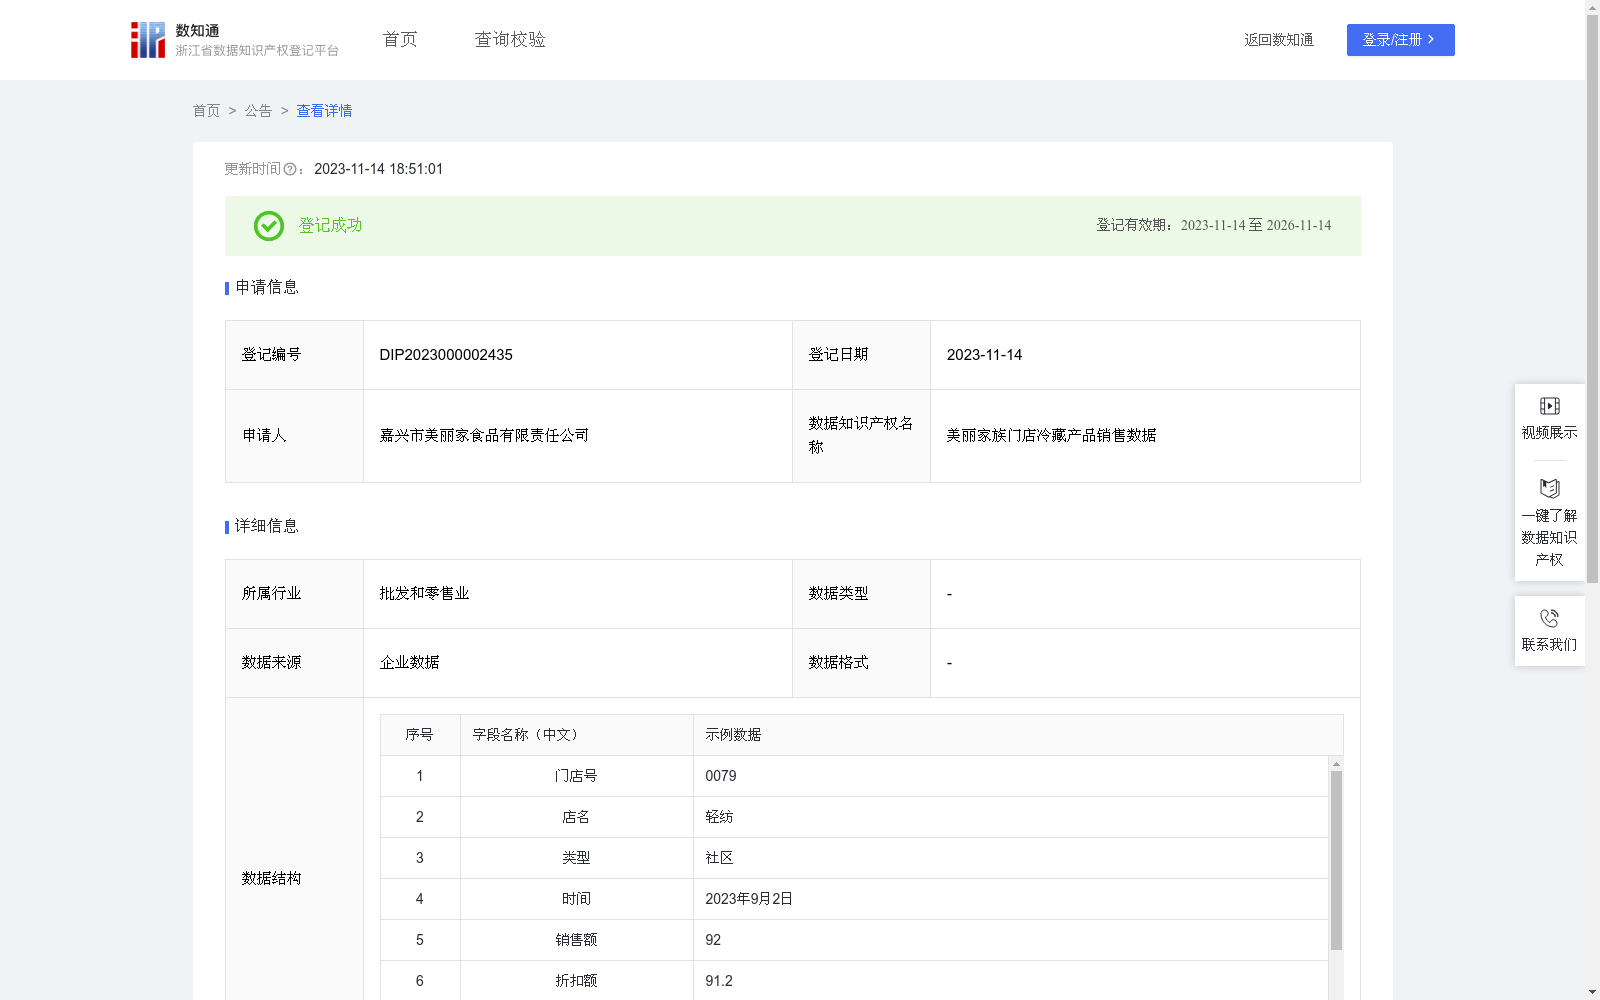
美丽家族门店冷藏产品销售数据
收藏资源简介:
通过对美丽家族门店每日冷藏产品的销售额、折扣额、面积、店员数、冰箱数、冷藏产品库存数等数据进行整理收集,分析美丽家族每日冷藏产品的销售额与折扣额、面积、店员数、冰箱数、冷藏产品库存数之间的关联度,找出影响每日冷藏产品的销售额高度关联的数据,分析数据间存在的关系,提升营销方式,优化基础设施配置,最大程度提高冷藏产品的销售额,总体提升门店的销售业绩。1、数据收集与整理:利用后台中心软件以及线下统计整理数据;2、数据处理:利用EViews软件,设定多元线性回归模型,Y=β0+β1X1+β2X2+β3X3+β4X4+β5X5,其中Y为销售额,X1为折扣额,X2为面积,X3为店员数,X4为冰箱数,X5为冷藏产品库存数,β0为截距项,β1-β5为其X1-X5的系数,通过OLS估计得出回归分析模型:Y=-0.419954+1.010614X1+0.005602X2-0.166469X3+5.538452X4-0.064002X5,再对模型存在多重共线性进行修正,逐步回归通过t检验和F检验,达到最优拟合程度的回归模型:Y=0.398541+1.010078X1+5.290983X4-0.066632X5;3、数据分析:通过最优模型分析出最具关联度的数据变化对冷藏产品销售额的影响;4、数据应用:提升营销方式,优化基础设施配置,提高冷藏产品销售额,实现利润最大化。
This study collects and organizes daily data of refrigerated products from Meilijia (Beautiful Family) stores, including sales revenue, discount amount, store area, number of sales associates, number of refrigerators, and inventory of refrigerated products. It aims to analyze the correlation between the daily sales revenue of refrigerated products and the above factors, identify the highly correlated data affecting the sales revenue, explore the inherent relationships among the data, optimize marketing strategies and infrastructure allocation, maximize the sales revenue of refrigerated products, and ultimately improve the overall sales performance of the stores. 1. Data Collection and Organization: Data is collected and organized using back-end central software and offline statistics. 2. Data Processing: Using EViews software, a multiple linear regression model is established as Y=β0+β1X1+β2X2+β3X3+β4X4+β5X5, where Y represents sales revenue, X1 represents discount amount, X2 represents store area, X3 represents number of sales associates, X4 represents number of refrigerators, X5 represents inventory of refrigerated products, β0 is the intercept term, and β1 to β5 are the coefficients of variables X1 to X5 respectively. The initial regression analysis model obtained via ordinary least squares (OLS) estimation is: Y=-0.419954+1.010614X1+0.005602X2-0.166469X3+5.538452X4-0.064002X5. Then, multicollinearity in the model is corrected, and stepwise regression is conducted through t-test and F-test to obtain the optimal regression model with the best fitting degree: Y=0.398541+1.010078X1+5.290983X4-0.066632X5. 3. Data Analysis: The impact of changes in the most correlated variables on the sales revenue of refrigerated products is analyzed using the optimal regression model. 4. Data Application: Optimize marketing strategies and infrastructure allocation, improve the sales revenue of refrigerated products, and achieve profit maximization.