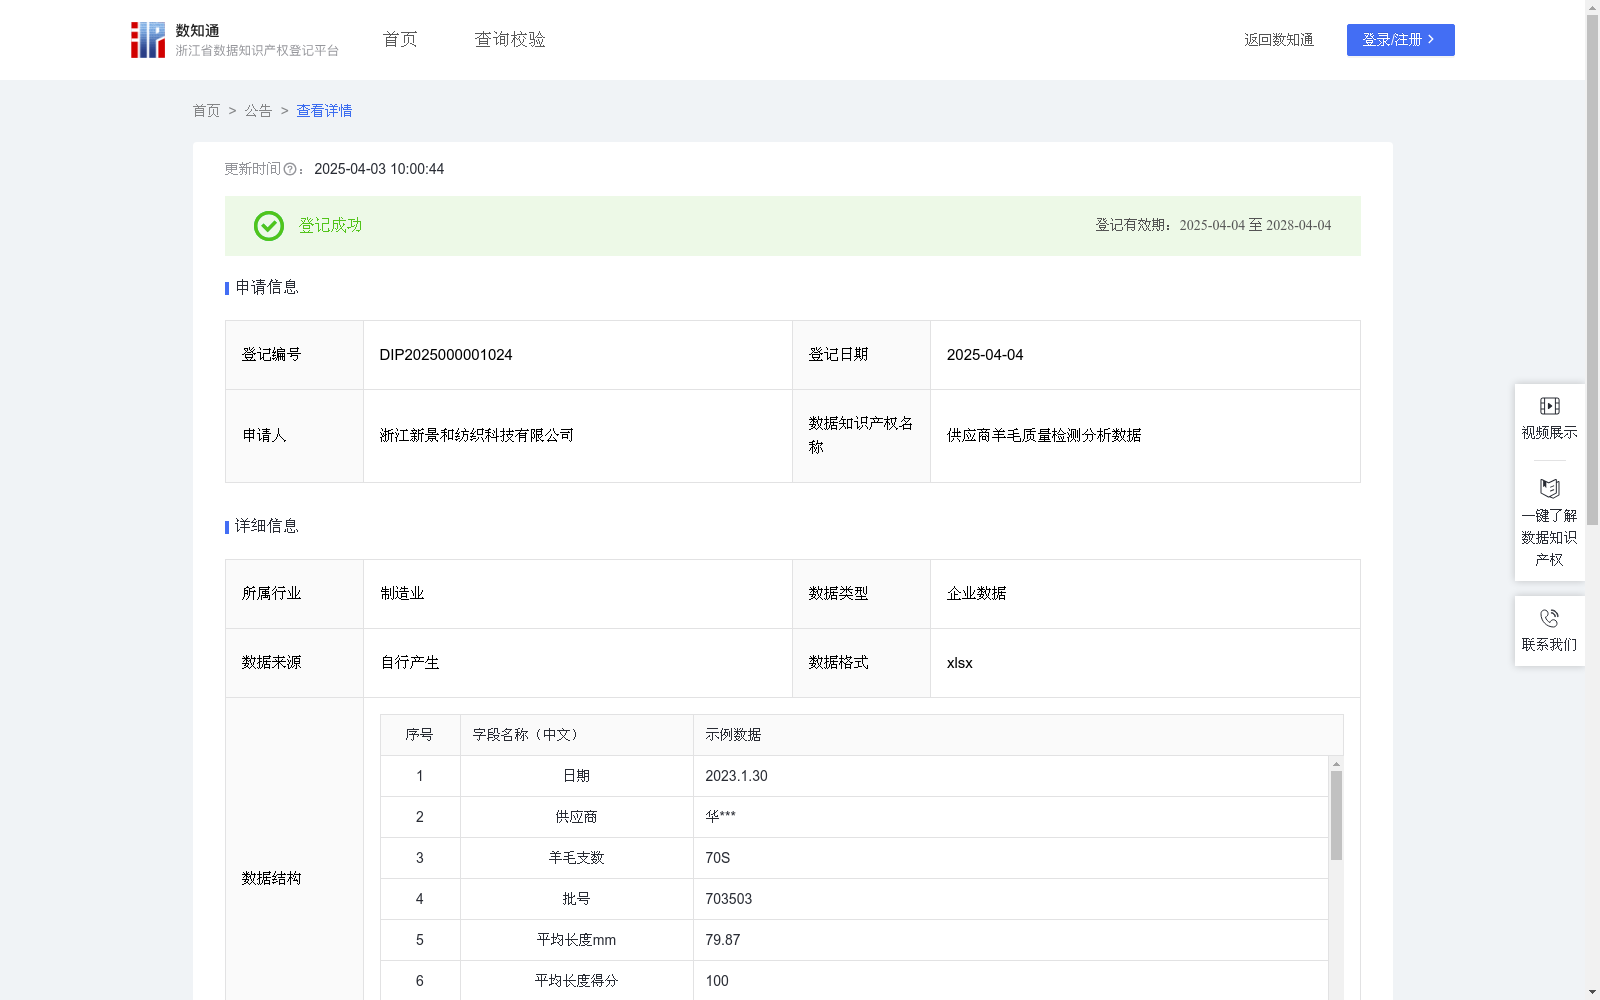
供应商羊毛质量检测分析数据
收藏资源简介:
" 在羊毛投入生产前进行检测和评级,能够有效预防羊毛质量问题引发的生产停滞、重复劳动及产品退货,从而提升生产流程的效率。羊毛检测和等级评定可以作为评估供应商的重要依据,帮助企业以同行企业选择优质的羊毛供应商,优化供应链结构。" "1.数据采集 采集收集每次进货数据,包括基础信息日期、供应商、羊毛支数、批号、平均长度、长度离散系数等。 2.算法规则 对七个维度赋分计算: (1)平均长度得分: [≥75mm]:100分;[70-74mm]:80分;[65-69mm]:60分;[<65mm]:30分。 (2) 30mm以下短毛率得分: [≤5%]:100分;[5.1-10%]:70分;[10.1-15%]:40分;[>15%]:0分。 (3) 长度离散系数得分: [≤25%]:100分;[25.1-30%]:75分;[30.1-35%]:50分;[>35%]:20分。 (4) 毛粒数得分: [≤1.0]:100分;[1.1-1.5]:75分;[1.6-2.0]:50分;[>2.0]:20分。 (5) 细度离散系数总得分: [≤15%]:100分;[15.1-20%]:60分;[20.1-25%]:30分;[>25%]:0分。 (6) 草屑数得分: [≤0.2]:100分;[0.21-0.3]:50分;[0.31-0.5]:20分;[>0.5]:0分。 (7)死毛数得分: [0]:100分;[0.1-0.5]:50分;[0.6-1.0]:20分;[>1.0]:0分。 (8)总得分=(平均长度得分×25%) + (短毛率得分×20%) + (长度离散系数得分×15%) + (毛粒得分×15%) + (细度离散系数得分×10%) + (草屑得分×10%) + (死毛得分×5%) 3.数据应用 根据总得分对供货商进行价值分级:A(A≥90):核心指标全优,适合高端订单;B(80≤B<90):关键指标达标,常规采购;C(70≤C<80分):存在1-2项风险,需改进后使用;D(D<70):重大质量问题,暂停合作。"
Detecting and grading wool before production can effectively prevent production downtime, rework, and product returns caused by wool quality issues, thereby improving production efficiency. Wool inspection and grading can serve as a vital basis for supplier evaluation, helping enterprises select high-quality wool suppliers relative to their industry peers and optimize the supply chain structure. 1. Data Collection Collect data for each incoming shipment, including basic information such as date, supplier, wool count, batch number, average fiber length, length coefficient of variation, etc. 2. Algorithm Rules Score calculation is conducted across seven dimensions: (1) Average Fiber Length Score: [≥75mm]: 100 points; [70-74mm]: 80 points; [65-69mm]: 60 points; [<65mm]: 30 points. (2) Short Fiber Content (≤30mm) Score: [≤5%]: 100 points; [5.1-10%]: 70 points; [10.1-15%]: 40 points; [>15%]: 0 points. (3) Length Coefficient of Variation Score: [≤25%]: 100 points; [25.1-30%]: 75 points; [30.1-35%]: 50 points; [>35%]: 20 points. (4) Wool Pellet Count Score: [≤1.0]: 100 points; [1.1-1.5]: 75 points; [1.6-2.0]: 50 points; [>2.0]: 20 points. (5) Fineness Coefficient of Variation Score: [≤15%]: 100 points; [15.1-20%]: 60 points; [20.1-25%]: 30 points; [>25%]: 0 points. (6) Grass Chip Count Score: [≤0.2]: 100 points; [0.21-0.3]: 50 points; [0.31-0.5]: 20 points; [>0.5]: 0 points. (7) Dead Fiber Count Score: [0]: 100 points; [0.1-0.5]: 50 points; [0.6-1.0]: 20 points; [>1.0]: 0 points. (8) Total Score = (Average Fiber Length Score × 25%) + (Short Fiber Content Score × 20%) + (Length Coefficient of Variation Score × 15%) + (Wool Pellet Count Score × 15%) + (Fineness Coefficient of Variation Score × 10%) + (Grass Chip Count Score × 10%) + (Dead Fiber Count Score × 5%) 3. Data Application Classify suppliers into value tiers based on their total scores: A (Score ≥90): All core indicators meet excellence standards, suitable for high-end orders; B (80 ≤ Score <90): Key indicators meet specified requirements, applicable for regular procurement; C (70 ≤ Score <80): 1-2 quality risks exist, usable after improvement; D (Score <70): Severe quality issues, suspend cooperation.