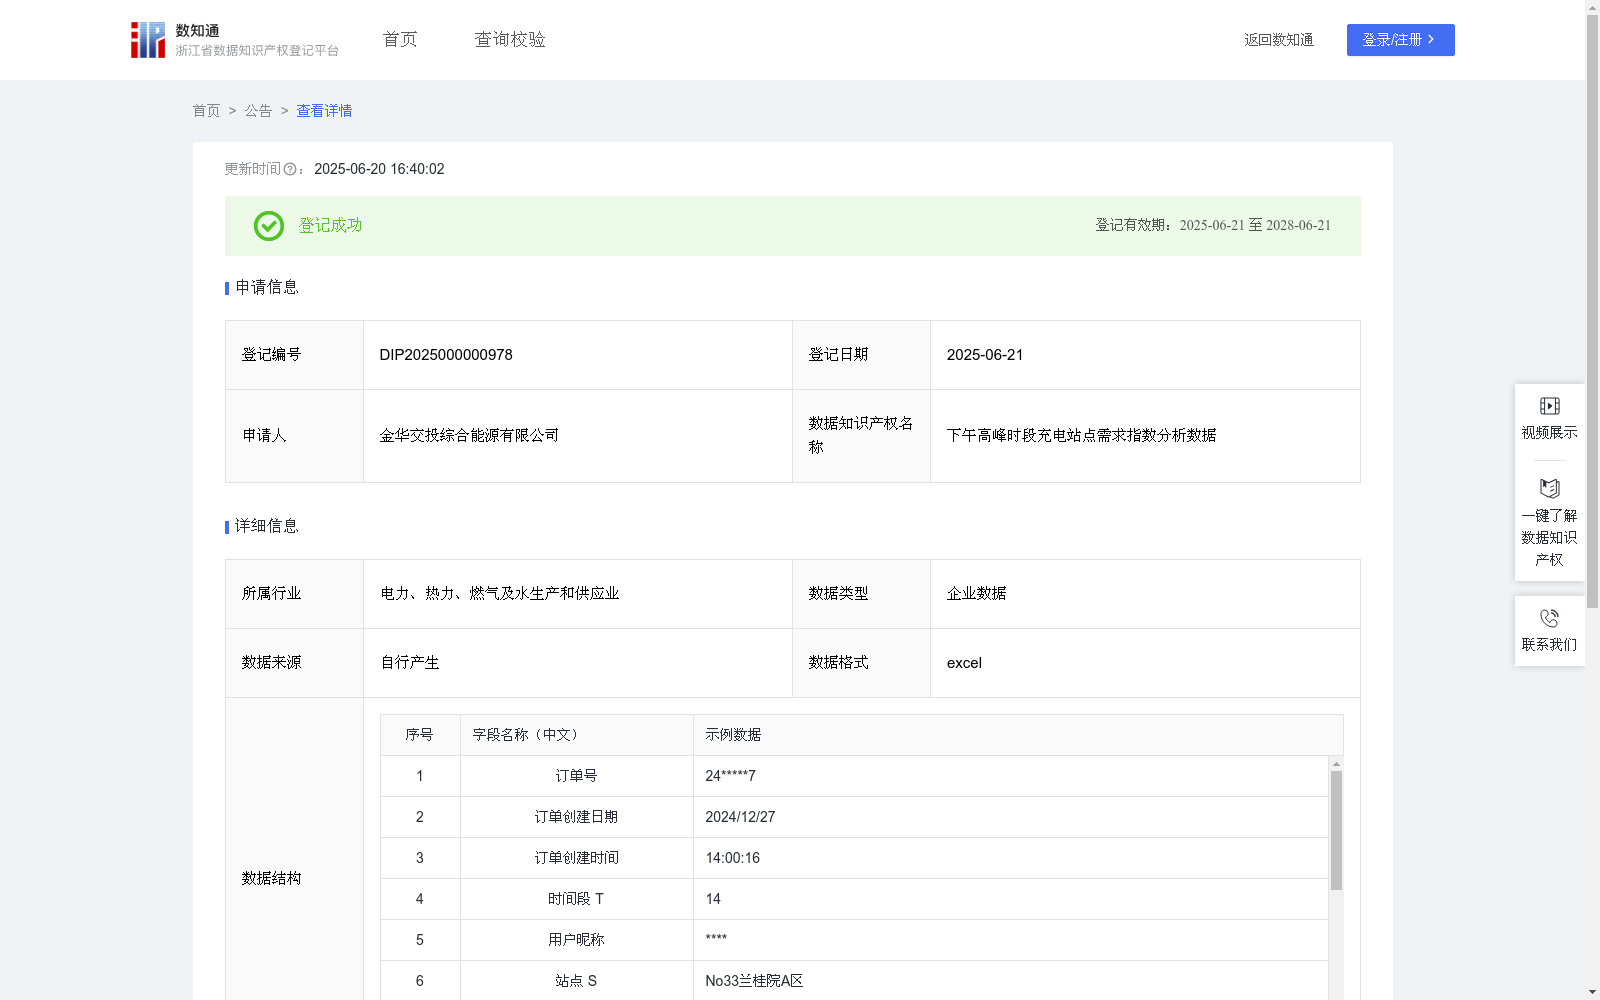
下午高峰时段充电站点需求指数分析数据
收藏资源简介:
收集下午高峰时段各充电站点充电订单数据,分析各站点需求指数变化情况。通过充电站点不同时段需求指数的分析,可以实现资源优化配置、提升用户体验、制定精准营销策略、支持城市规划和能源管理等多方面的目标。不仅有助于充电站点的可持续发展,也为电动自行车的推广和普及提供了有力支持。1.数据采集:收集下午高峰时段各充电站点充电订单数据,包含:订单号、订单创建日期、订单创建时间、时间段 T、用户昵称、站点S等字段;2.数据处理:对采集到的数据进行聚合与分类、清洗,去除空值。3、算法加工:对于每个充电站点,统计在每个时间段内发生的订单数量,使用COUNTIFS函数计算在时间段T内站点S的订单数量、站点S的总订单数量;时间段T为:14-20;计算需求指数 D(S,T) =在时间段 T 内站点 S 的订单数量/站点 S 的总订单数量×100%;4、数据应用:将需求指数进行可视化,绘制每个站点在不同时间段的需求指数图表,更直观地观察站点的使用情况。
This dataset collects charging order data for all charging stations during afternoon peak hours, and analyzes the changes in demand indices of each station. Through the analysis of demand indices of charging stations across different time periods, multiple objectives can be achieved, including optimal resource allocation, enhanced user experience, formulation of precise marketing strategies, support for urban planning and energy management, and more. This not only facilitates the sustainable development of charging stations, but also provides robust support for the promotion and popularization of electric bicycles. 1. Data Collection: Collect charging order data of each charging station during afternoon peak hours, including fields such as order number, order creation date, order creation time, time period T, user nickname, and station S. 2. Data Processing: Aggregate, classify and clean the collected data, and remove null values. 3. Algorithm Processing: For each charging station, count the number of orders occurring in each time period. Use the COUNTIFS function to calculate the number of orders of station S within time period T and the total number of orders of station S; the time period T ranges from 14 to 20; calculate the demand index D(S,T) = (Number of orders of station S within time period T / Total number of orders of station S) × 100%. 4. Data Application: Visualize the demand indices, draw demand index charts for each station across different time periods to more intuitively observe the usage status of the stations.