Chart-to-Experience
收藏资源简介:
Chart-to-Experience是一个包含36张图表的基准数据集,这些图表涵盖了COVID-19、房价和全球变暖三个主题,并经过众包工人的评估,以了解它们在七个体验因素上的影响。数据集包括情感因素(如同理心、兴趣、舒适度)和感知因素(如记忆性、可信度、审美愉悦感和直观性)。数据集的构建过程包括从互联网搜索中收集图表,并招募216名众包工人对每个图表的七个体验因素进行7分制的李克特量表评分。该数据集旨在解决数据可视化对用户体验的感知和情感影响预测问题,为多模态大型语言模型(MLLMs)的评估提供了一个新的基准。
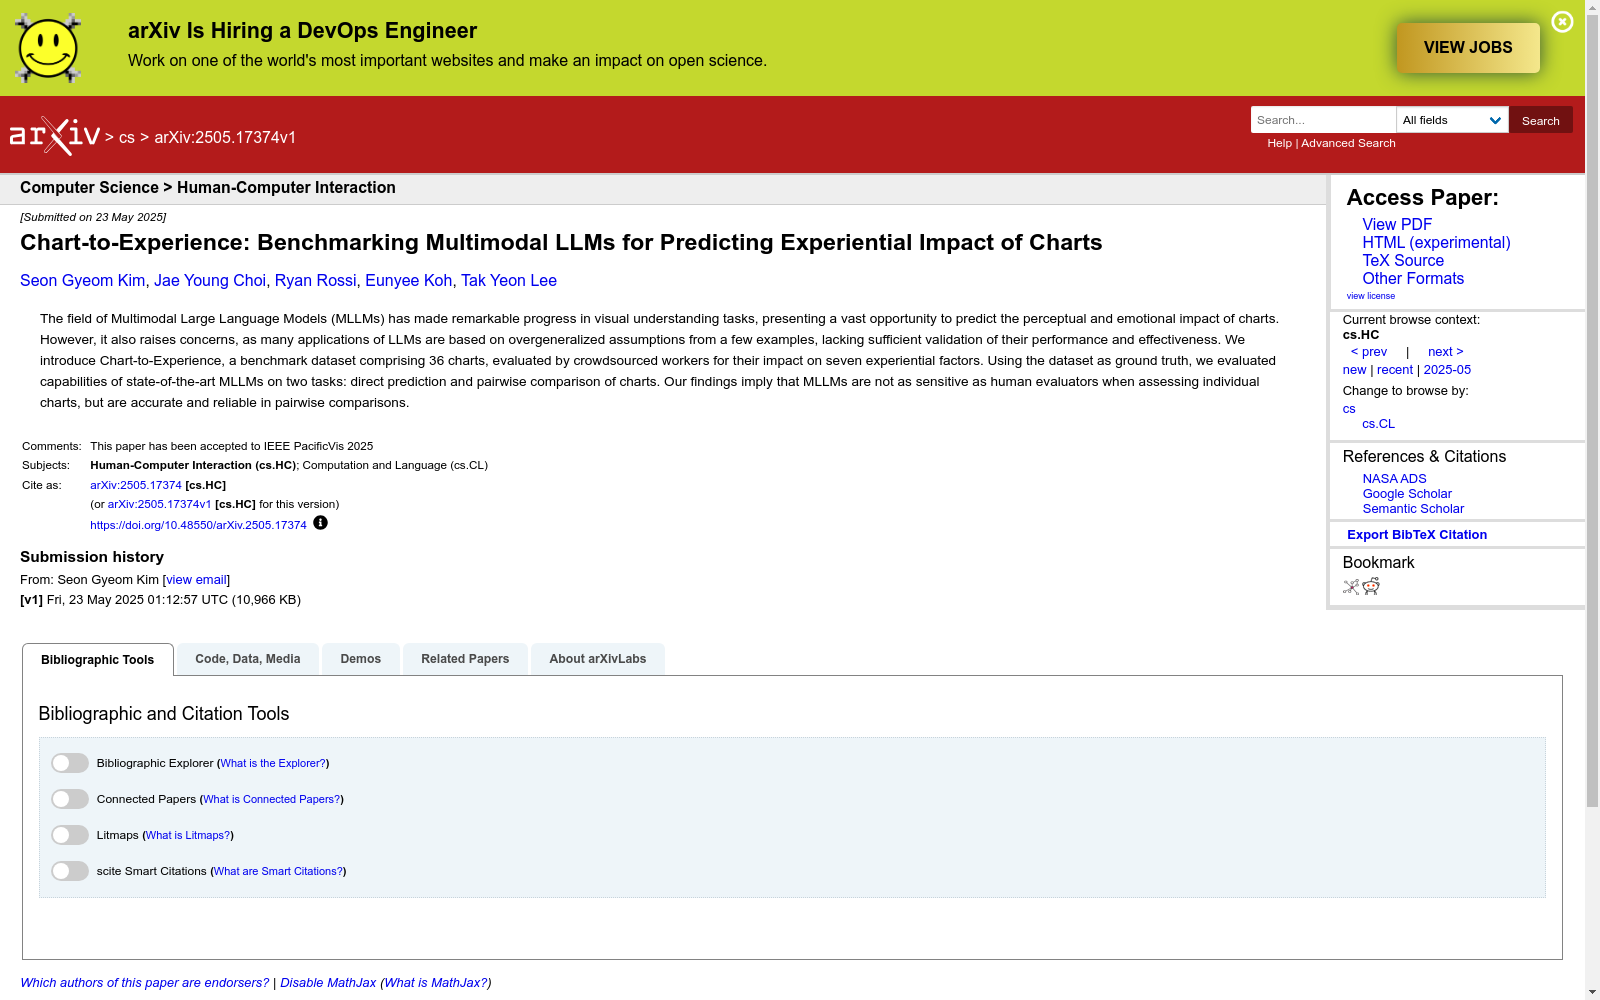
Chart-to-Experience is a benchmark dataset comprising 36 charts spanning three topics: COVID-19, housing prices, and global warming. These charts were evaluated by crowdworkers to assess their impacts on seven experience-related factors, which consist of affective factors (empathy, interest, and comfort) and perceptual factors (memorability, credibility, aesthetic pleasure, and intuitiveness). The dataset construction process involves collecting charts from internet searches and recruiting 216 crowdworkers to assign 7-point Likert scale ratings for each of the seven experience factors corresponding to every chart. This dataset is designed to tackle the problem of predicting the perceptual and affective impacts of data visualization on user experience, serving as a novel benchmark for the evaluation of multimodal large language models (MLLMs).