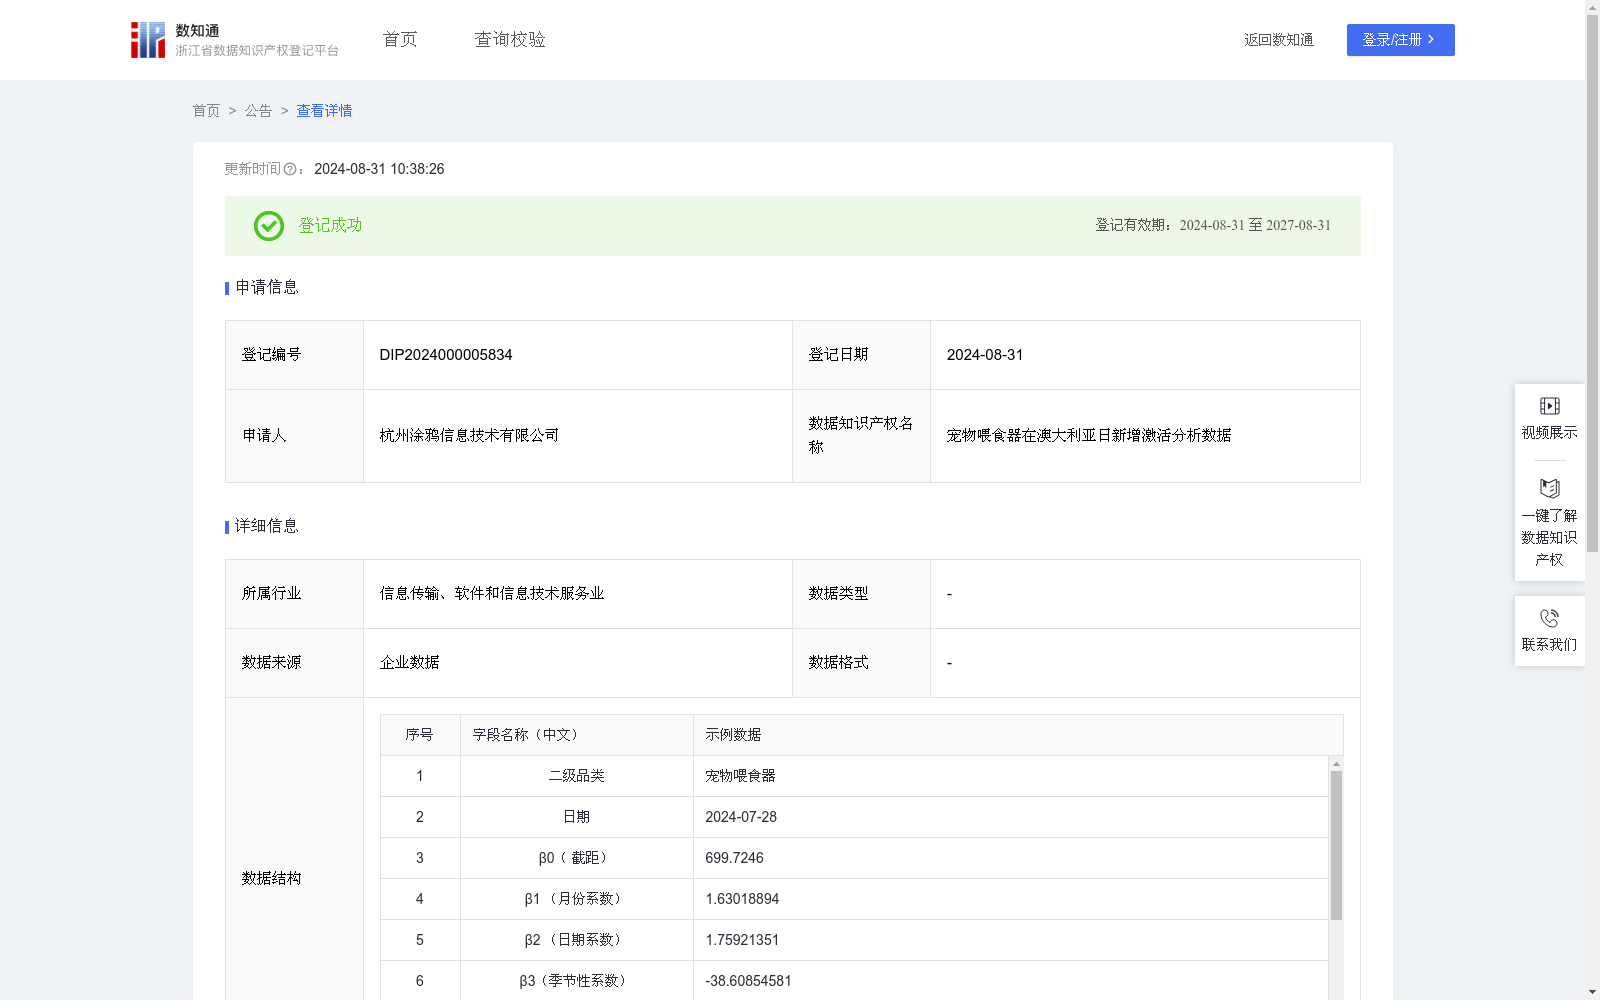
宠物喂食器在澳大利亚日新增激活分析数据
收藏资源简介:
根据市场研究,宠物喂食器市场正在经历强劲的增长,预计从2023年的21.1亿美元增长到2033年的62.9亿美元,复合年增长率为11.60%;通过预测宠物喂食器激活设备数据,企业可以规划市场促销活动或运营策略,以吸引更多企业客户。1. 模型选择:采用多元线性回归模型进行建模,根据宠物喂食器每天新激活设备数-实际值,预测宠物喂食器在未来一段时间的日新增激活设备数; 2. 模型原理:多元回归分析常用于研究两个或以上自变量与一个因变量之间的线性关系。本次分析目标是预测未来一段时间激活设备数,我们将考虑以下自变量:月份、日期、季节性波动,并考虑高峰/低谷影响; 3. 建模与结果预测:考虑季节波动,增加季节性特征;结合峰值异常剧增影响,故再增加高峰月份特征,然后进行回归模型的训练;最终优化下来,该回归模型表达式为:Y=β0+β1*X1+β2*X2+β3*X3+β4*X4。其中,Y为要预测的因变量、X1为月份、X2为日期、X3为季节特征、X4是否高峰期,β0为截距,通过最小二乘法在模型拟合过程中计算得出,取值为699.7246)、β1~β4是自变量的回归系数,β1=1.63018894(月份系数),β2=1.75921351(日期系数),β3=-38.60854581(季节性系数),β4=189.37624029(波峰月系数)。通过回归表达式,预测未来一段时间澳大利亚地区宠物喂食器每日新激活设备数。
According to market research, the pet feeder market is experiencing robust growth, and is projected to grow from $2.11 billion in 2023 to $6.29 billion in 2033, with a compound annual growth rate (CAGR) of 11.60%. By forecasting the activated device data of pet feeders, enterprises can plan marketing campaigns or operational strategies to attract more business customers. 1. Model Selection: A multiple linear regression model is adopted for modeling. Based on the actual daily number of newly activated devices of pet feeders, the model is used to predict the daily number of newly activated devices of pet feeders over a future period. 2. Model Principle: Multiple regression analysis is commonly used to study the linear relationship between two or more independent variables and one dependent variable. The goal of this analysis is to predict the number of activated devices over a future period. The following independent variables will be considered: month, date, seasonal fluctuations, as well as peak/trough impacts. 3. Modeling and Result Forecasting: Considering seasonal fluctuations, seasonal features are added; combined with the impact of abnormal surges in peak periods, peak month features are further added before training the regression model. After final optimization, the regression model expression is: Y=β0+β1*X1+β2*X2+β3*X3+β4*X4. Where Y is the dependent variable to be predicted, X1 represents month, X2 represents date, X3 represents seasonal features, and X4 indicates whether it is a peak period. β0 is the intercept, which is calculated via the least squares method during model fitting, with a value of 699.7246; β1~β4 are the regression coefficients of the independent variables: β1=1.63018894 (month coefficient), β2=1.75921351 (date coefficient), β3=-38.60854581 (seasonal coefficient), β4=189.37624029 (peak month coefficient). This regression expression is used to predict the daily number of newly activated devices of pet feeders in the Australian region over a future period.