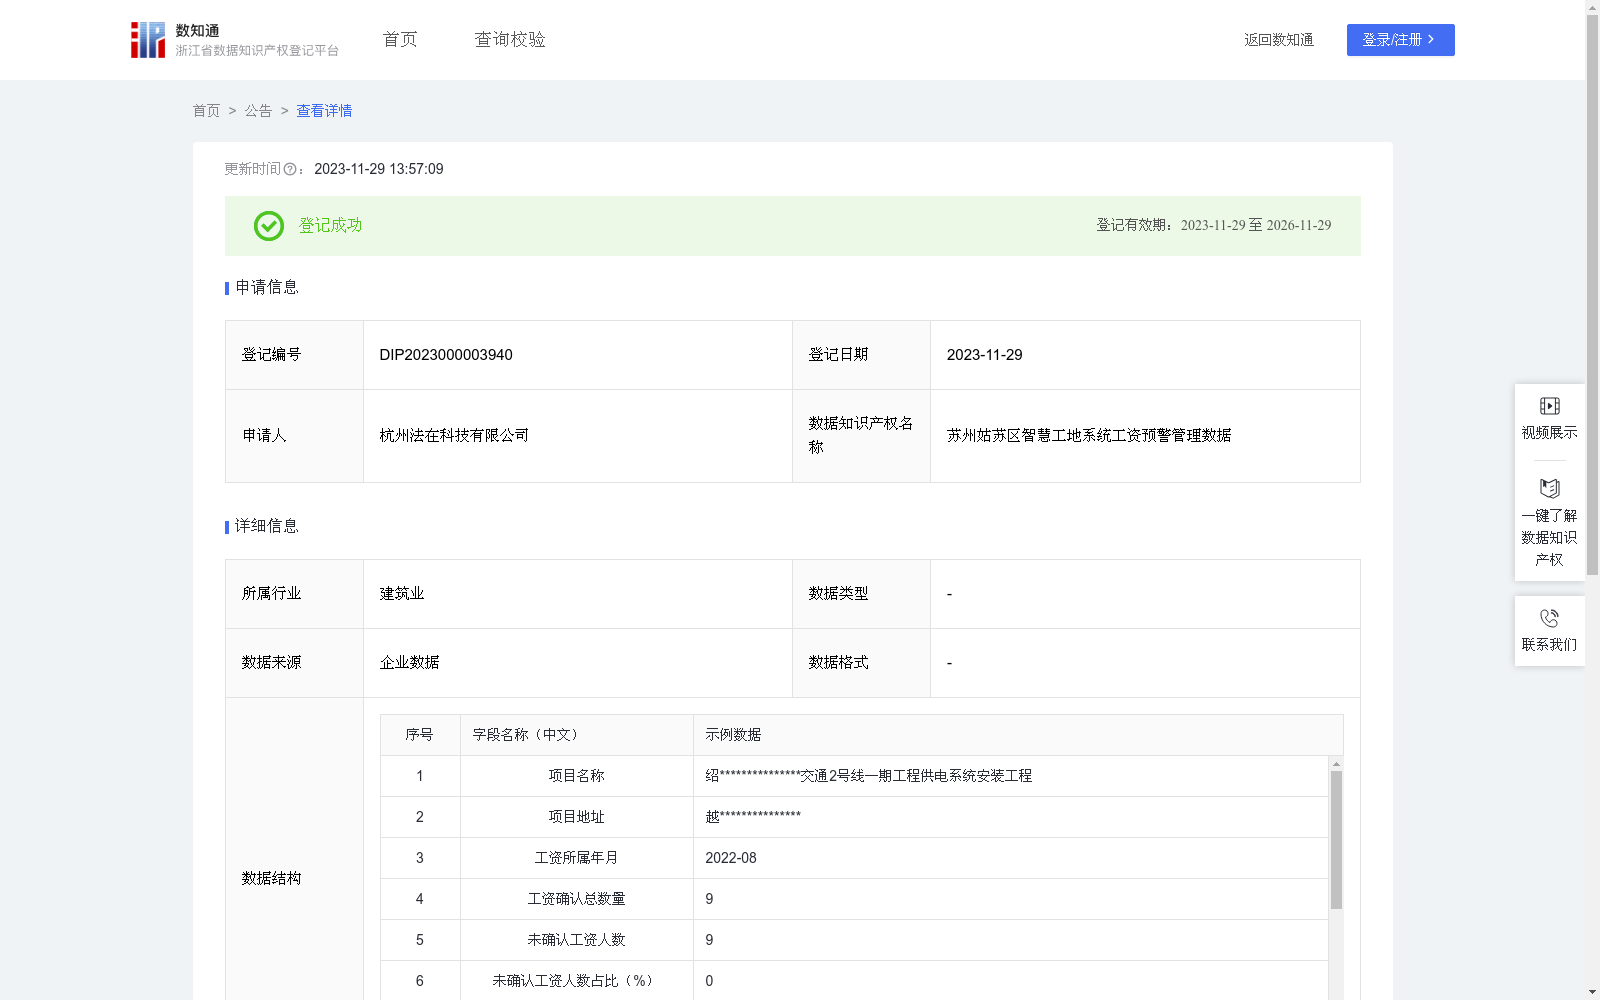
苏州姑苏区智慧工地系统工资预警管理数据
收藏资源简介:
采集苏州姑苏区范围内工资信息线下通过设备和手动录入的方式采集数据到数据库作为原始数据源。最后通过BI工具,按区域工种进行分类统计,利用折线图体现每个地区工种的工资风险走势情况。推送给班组长、企业、劳务公司、监管部门。(1)数据采集:采集苏州姑苏区范围内工资信息线下通过设备和手动录入的方式采集数据到数据库作为原始数据源。(2)数据处理:首先对采集的工资确认数据进行清洗,包括工资金额为0的或者为null的。然后对数据在时间维度按日,项目维度按企业,区域维度按区域,进行最细级别粒度的聚合。计算得到各工地的工资确认总数量为X,未确认工资人数/X=未确认人数在总工资发放中的占比, 待处理数为已经采集且并未介入处理数, 已处理数为已经开始处理的数量,已完成数为已经确认工资发放的数量,超时未处理数为超时未处理数指超过1天未处理数,X=待处理数+已处理数+已完成数。(3)数据分析: 低危风险数=企业待处理数低于总比10%且超时未处理数低于5%,中危风险数=企业待处理数低于总比20%且超时未处理数低于10%,高危风险数=企业待处理数低于总比30%且超时未处理数低于15%。
This dataset is developed based on wage information collected within Gusu District, Suzhou. The original data source is obtained via offline device entry and manual input, which is then stored in a database. Business Intelligence (BI) tools are subsequently used to conduct classified statistics by region and job type, and visualize the wage risk trends of job types in each region with line charts. The analysis results will be pushed to team leaders, enterprises, labor service companies, and regulatory authorities. (1) Data Collection: Collect wage information within the scope of Gusu District, Suzhou via offline devices and manual entry, and store the collected data into the database as the original data source. (2) Data Processing: First, clean the collected wage confirmation data by removing records with a wage amount equal to 0 or null. Then, perform aggregation at the finest granularity across three dimensions: time (by day), project (by enterprise), and region (by district). Calculate the total number of wage confirmations for each construction site as X. The proportion of unconfirmed wage recipients in total wage payments is calculated as (unconfirmed number)/X. The pending processing count refers to the number of collected but unprocessed records; the processed count refers to the number of records that have started the processing workflow; the completed count refers to the number of records with confirmed wage disbursement; the overdue unprocessed count refers to the number of records that have not been processed for more than 1 consecutive day. The total count X satisfies the formula: X = pending processing count + processed count + completed count. (3) Data Analysis: Low-risk count refers to enterprises with pending processing count accounting for less than 10% of the total X and overdue unprocessed count accounting for less than 5% of the total X; Medium-risk count refers to enterprises with pending processing count accounting for less than 20% of the total X and overdue unprocessed count accounting for less than 10% of the total X; High-risk count refers to enterprises with pending processing count accounting for less than 30% of the total X and overdue unprocessed count accounting for less than 15% of the total X.