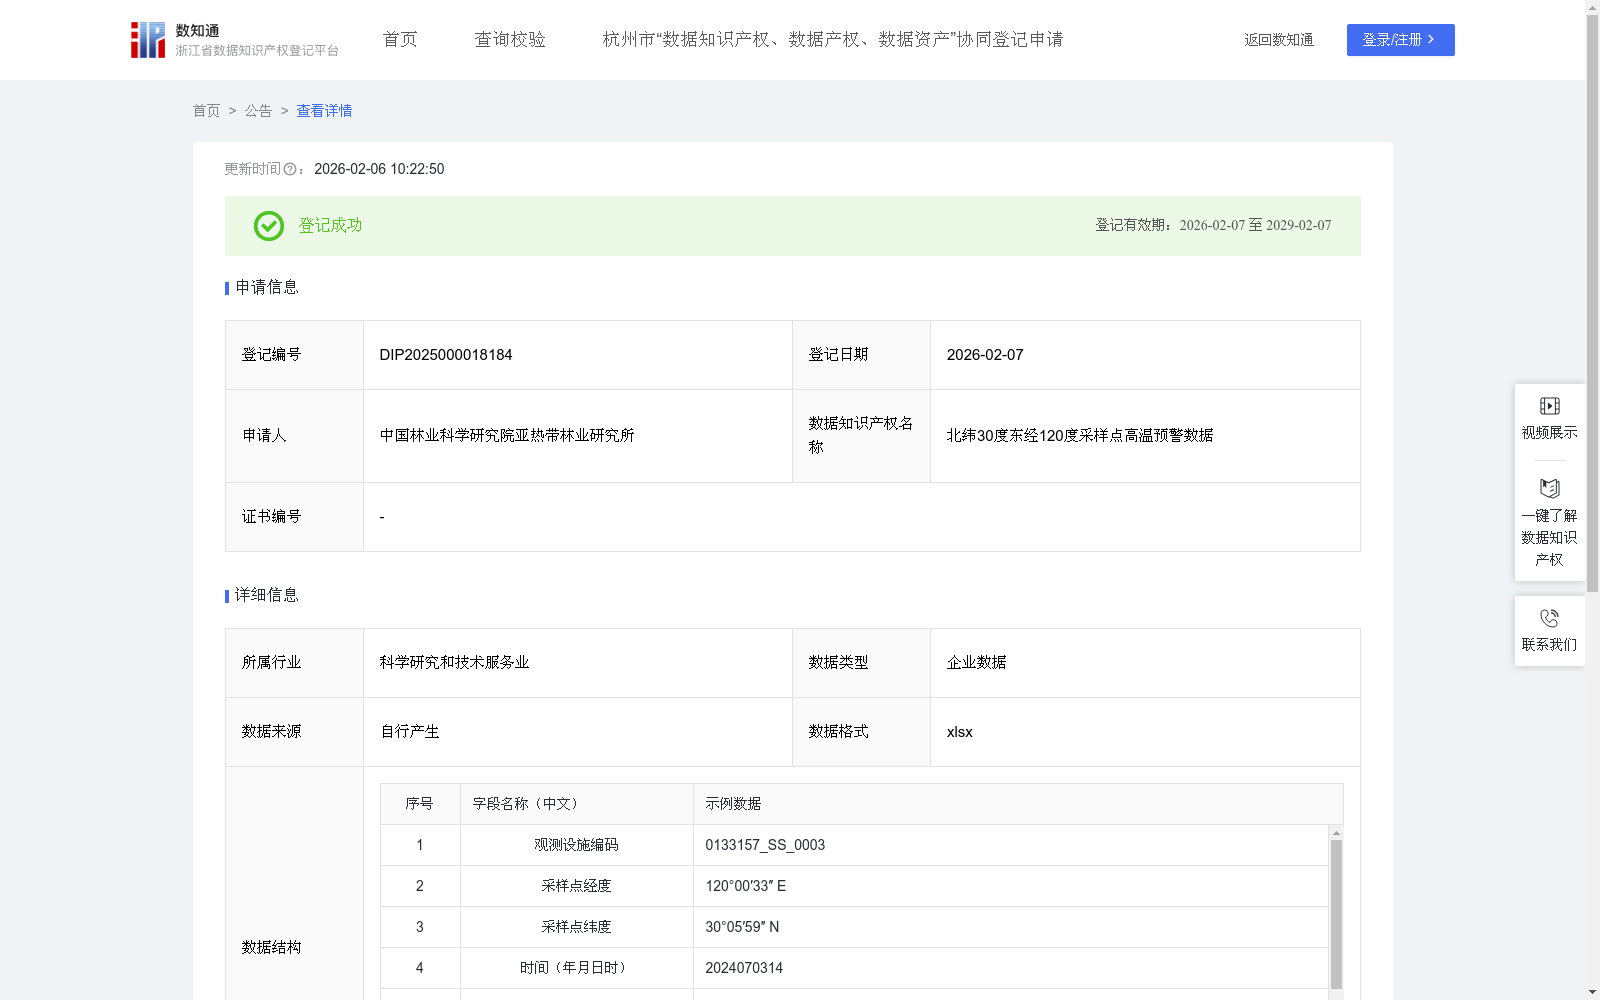
北纬30度东经120度采样点高温预警数据
收藏资源简介:
该数据可用于绘制全年体感温度的热力图,直观展示其日变化和季节变化。有利于识别极端高温高湿天气,发布健康预警,可用于制定科学的户外工作“停工令”。1.数据采集:根据气象学标准,设置专业气象采集点,采集实时气压、十米处风速、空气温度、空气湿度数据,时间做到以每小时为间隔,全年不间断采集; 2.数据处理:将数据去噪、优化、补全; 3.数据加工:①饱和水汽压(E)≈ 6.11*10^(7.5*空气温度/ (237.3 + 空气温度))。②实际水汽压(e) = (空气湿度 / 100) * 饱和水汽压(E)。③体感温度=空气温度 + 0.33*实际水汽压 - 0.70*十米处风速- 4.00。计算结果保留小数点后三位。 4.数据判断:当体感温度连续3小时超过40℃,且空气温度持续高于35℃时触发高温预警。
This dataset can be used to generate heatmaps of annual apparent temperature, intuitively displaying its diurnal and seasonal variations. It aids in identifying extreme high-temperature and high-humidity weather events, issuing health warnings, and formulating scientific "work stoppage orders" for outdoor operations. 1. Data Collection: In accordance with meteorological standards, professional meteorological monitoring stations are deployed to collect real-time data including atmospheric pressure, 10-meter wind speed, air temperature and air humidity. Data is collected at hourly intervals with uninterrupted annual sampling. 2. Data Preprocessing: The collected data is denoised, optimized and gap-filled. 3. Data Calculation: ① Saturation water vapor pressure (E) ≈ 6.11 × 10^( (7.5 × air temperature) / (237.3 + air temperature) ). ② Actual water vapor pressure (e) = (air humidity / 100) × saturation water vapor pressure (E). ③ Apparent temperature = air temperature + 0.33 × actual water vapor pressure - 0.70 × 10-meter wind speed - 4.00. All calculation results are retained to three decimal places. 4. Data Judgement: A high-temperature warning is triggered when the apparent temperature exceeds 40°C for 3 consecutive hours and the air temperature stays above 35°C.