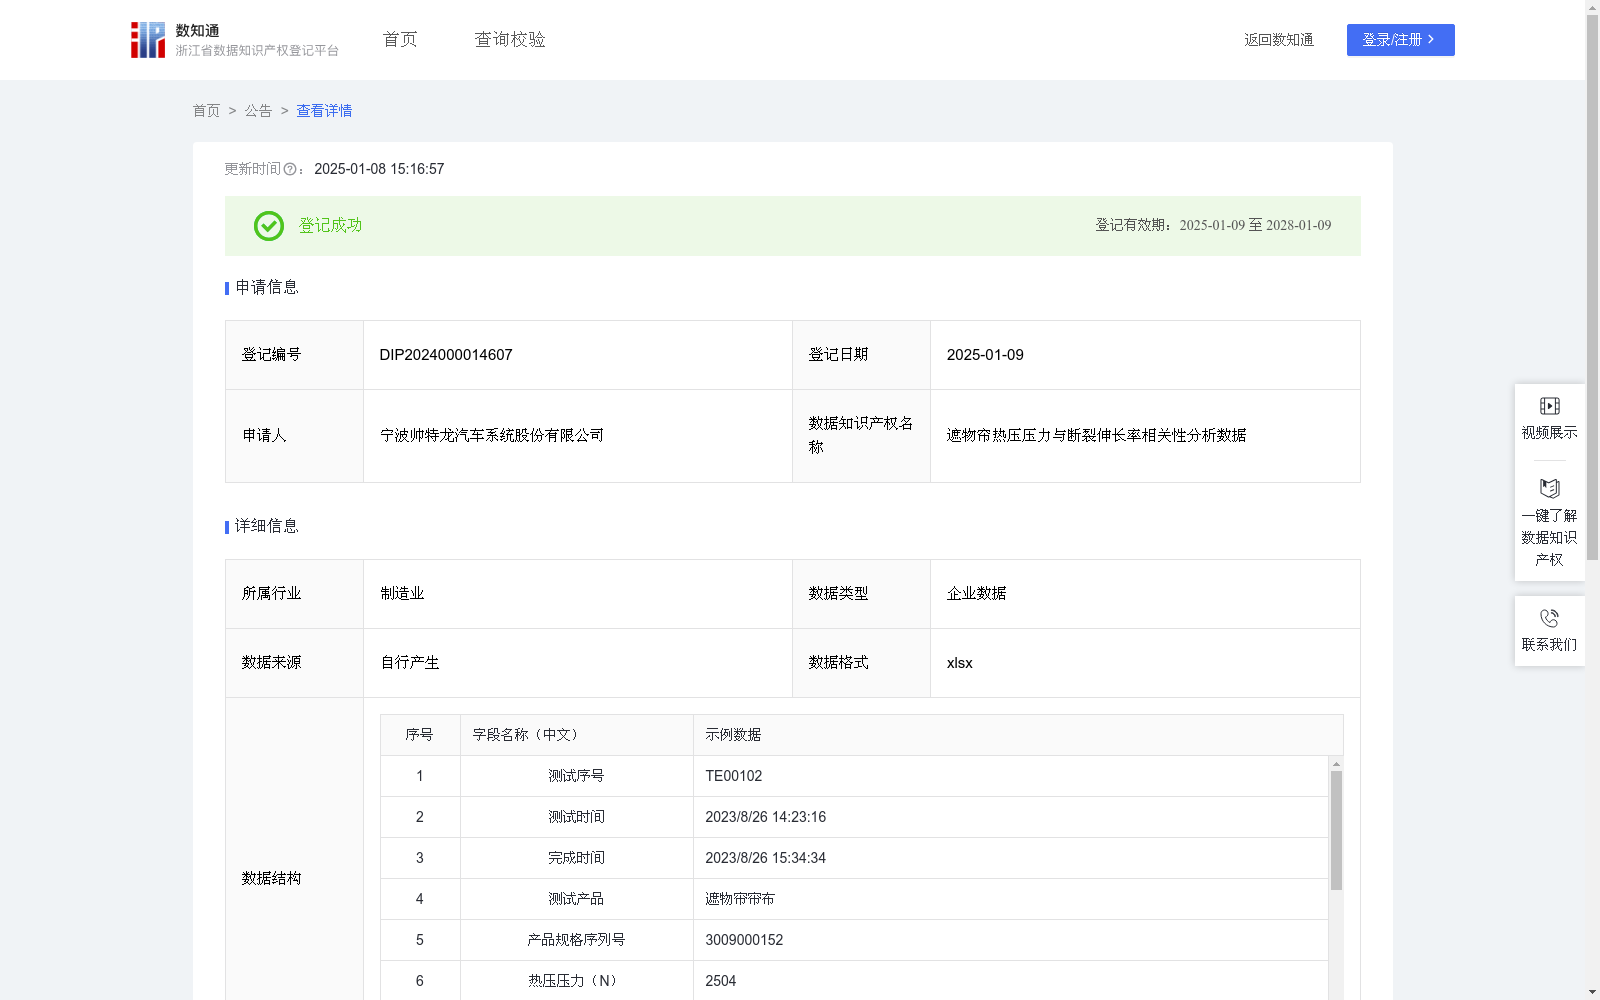
遮物帘热压压力与断裂伸长率相关性分析数据
收藏资源简介:
本数据是基于控制变量法测试遮物帘帘布在不同热压压力下的断裂伸长率,并对此进行分析,以得出热压压力和断裂伸长率的相关性指数结果。 本数据有助于本公司和其他遮物帘帘布制造商了解热压工序的不同热压压力对遮物帘帘布断裂伸长率的影响,利用平均热压压力、平均断裂伸长率以及相关性指数数据,调整设定最佳的热压压力范围,以确保产品达到所需的帘布断裂伸长率标准,保证产品性能质量。 本数据可为遮物帘帘布相关生产设备及系统服务商开发智能控制系统提供数据支撑,助力实现自动调整热压时间以维持理想的断裂伸长率。 本数据可以为高校及科研院所实验室开展遮物帘帘布的断裂伸长率研究提供数据支持。1. 数据采集和预处理:从公司内部的测试数据库中采集测试序号、测试时间、完成时间、测试产品、产品规格序列号、热压压力、断裂伸长率、样本数量。数据预处理:对数据进行清洗,去除异常值,平滑数据,以确保数据的准确性和可用性。 2.相关性指数计算:1)计算历史测试数据叠加本次测试结果后的热压压力(T)和断裂伸长率(L)测试结果的平均值(μT和μL)和标准差(σT和σL);2)计算协方差:协方差表示两个变量的共同变异趋势,计算公式为: Cov(T,L)=n−(∑ (Ti−μT)(Li−μL))/(n-1),其中,Ti和Li分别是单次测试的热压压力和断裂伸长率结果,n是样本数量。3)计算皮尔逊相关系数:皮尔逊相关系数(r)是度量两个变量线性相关程度的统计指标,计算公式为:r=Cov(x,y)/σxσy。4)转换为相关性指数:将皮尔逊相关系数转换为0到100的范围,以创建相关性指数=(r+1)×50,相关性指数的值介于0到100之间,其中100表示完全正相关,0表示完全负相关,50表示没有线性关系。
This dataset is developed based on the controlled variable method to test and analyze the elongation at break of sunshade curtain fabrics under different hot pressing pressures, aiming to obtain the correlation index results between hot pressing pressure and elongation at break. This data helps the company and other sunshade curtain fabric manufacturers understand the impact of different hot pressing pressures in the hot pressing process on the elongation at break of sunshade curtain fabrics. By utilizing the average hot pressing pressure, average elongation at break and correlation index data, the optimal hot pressing pressure range can be adjusted and set to ensure that the product meets the required elongation at break standards, thus guaranteeing the product performance and quality. This dataset can provide data support for relevant production equipment and system service providers of sunshade curtain fabrics to develop intelligent control systems, assisting in the automatic adjustment of hot pressing time to maintain the ideal elongation at break. It can also offer data support for universities and research institute laboratories to conduct research on the elongation at break of sunshade curtain fabrics. 1. Data collection and preprocessing: Collect test serial number, test time, completion time, tested product, product specification serial number, hot pressing pressure, elongation at break and sample quantity from the company's internal test database. Data preprocessing: Clean the data, remove outliers and smooth the data to ensure the accuracy and availability of the dataset. 2. Correlation index calculation: 1) Calculate the average values (μ_T and μ_L) and standard deviations (σ_T and σ_L) of the hot pressing pressure (T) and elongation at break (L) test results after combining historical test data and this test result; 2) Calculate the covariance: Covariance represents the co-variation trend of two variables, and the calculation formula is: Cov(T,L) = [∑(T_i−μ_T)(L_i−μ_L)]/(n−1), where T_i and L_i are the hot pressing pressure and elongation at break results of a single test respectively, and n is the sample size; 3) Calculate the Pearson correlation coefficient: The Pearson correlation coefficient (r) is a statistical indicator that measures the linear correlation degree between two variables, and the calculation formula is: r = Cov(x,y)/(σ_xσ_y); 4) Convert to correlation index: Convert the Pearson correlation coefficient to the range of 0 to 100 to obtain the correlation index = (r+1)×50. The value of the correlation index ranges from 0 to 100, where 100 represents a perfect positive correlation, 0 represents a perfect negative correlation, and 50 represents no linear relationship.