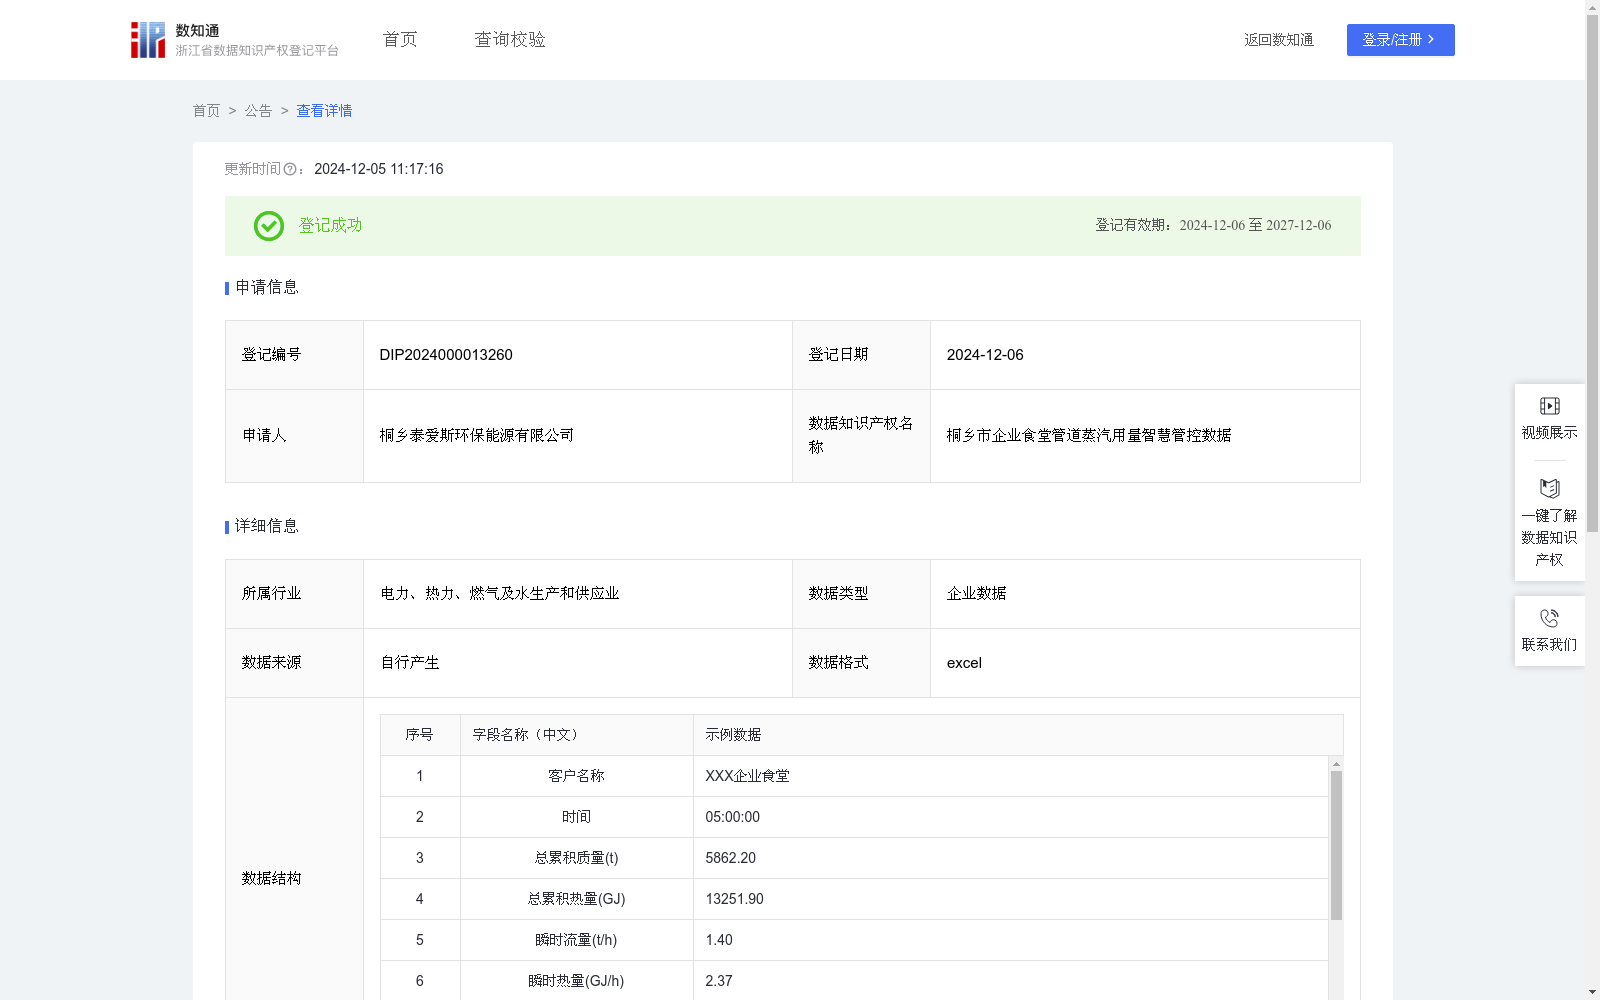
桐乡市企业食堂管道蒸汽用量智慧管控数据
收藏资源简介:
通过收集和分析企业食堂管道蒸汽用量的时间、总累积质量、总累积热量、瞬时流量、瞬时热量、瞬时温度、瞬时压力、密度、输入电流等相关数据,企业可以根据历史蒸汽用量智慧管控数据来制定更加精准的食堂成本预算。通过分析过去的蒸汽用量波动情况构建卷积神经网络模型,合理预估下一阶段(季度、年度)的蒸汽费用预算。如果发现某一时期蒸汽用量异常增加,可能预示着管道老化导致蒸汽泄漏或者烹饪流程的改变等情况,企业可以及时调整预算分配。通过该模型,食堂管理人员可以提前预测蒸汽需求高峰,合理安排烹饪时间和菜品供应顺序。在就餐人数较多的时段,保证有足够的蒸汽用于快速加热饭菜,避免顾客长时间等待,也可以根据蒸汽用量数据来调整食堂服务窗口的开放数量和服务速度,提高就餐效率。该模型对其他企业食堂提供借鉴价值,通过管控蒸汽用量和相关参数,实现社会资源的合理配置、经济的精准调控,有助于社会向低碳经济转型。根据企业食堂对食品安全的严格把控,生产的环节严格管控,选用卷积神经网络模型进行构建。步骤1:数据进行收集处理,整理为一个形状为(n_samples, 9)的numpy数组,管道蒸汽用量的时间、总累积质量、总累积热量、瞬时流量、瞬时热量、瞬时温度、瞬时压力、密度、输入电流分别为9个特征,再进行标准化处理,使得每个特征的均值为0,标准差为1。步骤2:利用python创建模型,添加一维卷积层、最大池化层,添加第二个卷积层、最大池化层,将卷积层的输出展平,添加全连接层,最后添加输出层,模型核心为使用一维卷积层来提取特征,然后通过最大池化层降低特征维度,将卷积层的输出展平后连接全连接层,最后输出一个预测值。步骤3:对模型进行编译,划分训练集、验证集和测试集,最后对输入数据进行形状调整,以适应卷积层的输入要求,再训练该模型。步骤4:测试和评估模型性能,绘制训练和验证损失曲线,观察训练过程,防止过拟合。该模型让企业食堂实现精准地控制蒸汽的产生和使用,减少蒸汽浪费的现象。步骤5:卷积神经网络模型输出预测蒸汽流量值和最高临界值为17.03t/h,当预测蒸汽流量值>17.03t/h,管道状态显示“管道异常”,当0≤预测蒸汽流量值≤17.03t/h,显示“管道正常”。
By collecting and analyzing relevant data including the time of pipeline steam usage, total cumulative mass, total cumulative heat, instantaneous flow rate, instantaneous heat, instantaneous temperature, instantaneous pressure, density, and input current in corporate canteens, enterprises can formulate more accurate canteen cost budgets based on intelligently managed historical steam usage data. By analyzing past steam usage fluctuations, a Convolutional Neural Network (CNN) model can be constructed to reasonably predict steam cost budgets for the next stage (quarterly, annual). If an abnormally increased steam usage is detected in a certain period, it may indicate steam leakage caused by pipeline aging or changes in cooking procedures, and enterprises can adjust budget allocations in a timely manner. With this model, canteen managers can predict peak steam demand in advance, reasonably arrange cooking schedules and the order of dish preparation. During peak dining hours, sufficient steam can be guaranteed to quickly heat meals, avoiding long customer waits. Additionally, the number of open service counters and service speed in the canteen can be adjusted based on steam usage data, improving dining efficiency. This model offers reference value for other corporate canteens: by controlling steam usage and related parameters, rational allocation of social resources and precise economic regulation can be achieved, contributing to the society's transition to a low-carbon economy. Based on the strict food safety control and production link management of corporate canteens, the Convolutional Neural Network model is selected for construction. Step 1: Data collection and preprocessing. Organize the data into a NumPy array with shape (n_samples, 9), where the nine features are respectively the time of pipeline steam usage, total cumulative mass, total cumulative heat, instantaneous flow rate, instantaneous heat, instantaneous temperature, instantaneous pressure, density, and input current. Then perform standardization processing so that each feature has a mean of 0 and a standard deviation of 1. Step 2: Build the model using Python. Add a 1D convolutional layer and a max pooling layer, then add a second convolutional layer and a max pooling layer. Flatten the output of the convolutional layers, add a fully connected layer, and finally add an output layer. The core of the model is to use 1D convolutional layers to extract features, reduce feature dimensionality via max pooling layers, flatten the output of the convolutional layers, connect to fully connected layers, and finally output a predicted value. Step 3: Compile the model, split the dataset into training, validation, and test sets, reshape the input data to meet the input requirements of the convolutional layers, and then train the model. Step 4: Test and evaluate model performance, plot training and validation loss curves, observe the training process, and prevent overfitting. This model enables corporate canteens to precisely control steam generation and usage, reducing steam waste. Step 5: The Convolutional Neural Network model outputs predicted steam flow values with a maximum threshold of 17.03 t/h. When the predicted steam flow value > 17.03 t/h, the pipeline status is displayed as "Abnormal Pipeline"; when 0 ≤ predicted steam flow value ≤ 17.03 t/h, the status is displayed as "Normal Pipeline".