
ISIS 2 CRC Electron Density Profiles
收藏DataCite Commons2026-02-12 更新2024-07-13 收录
下载链接:
https://spase-metadata.org/NASA/NumericalData/ISIS2/SFS/TOPS
下载链接
链接失效反馈官方服务:
资源简介:
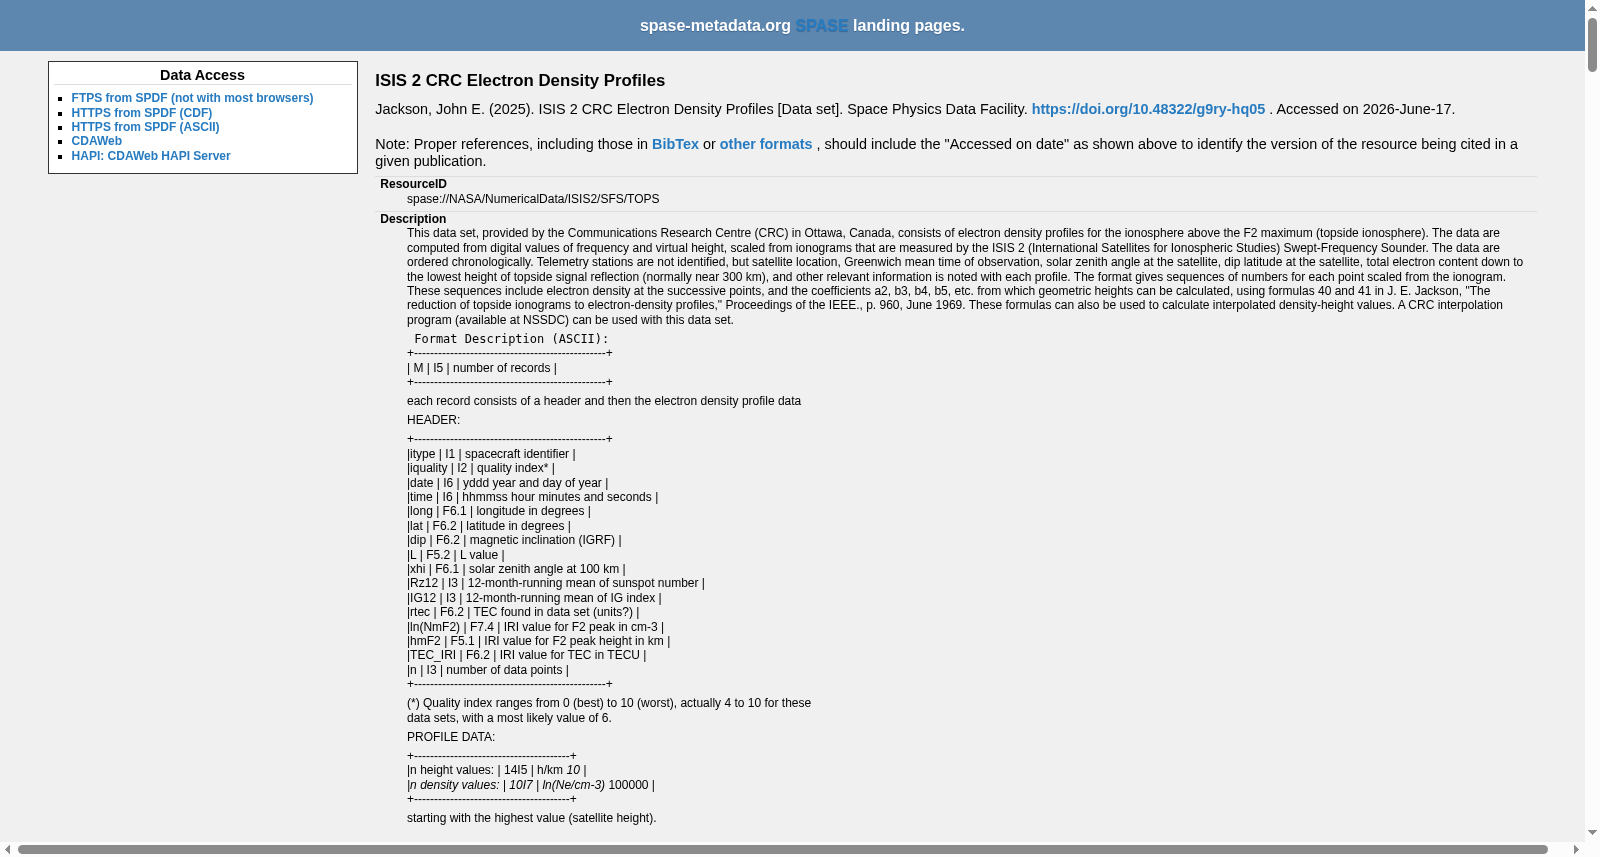
This data set, provided by the Communications Research Centre (CRC) in Ottawa, Canada, consists of electron density profiles for the ionosphere above the F2 maximum (topside ionosphere). The data are computed from digital values of frequency and virtual height, scaled from ionograms that are measured by the ISIS 2 (International Satellites for Ionospheric Studies) Swept-Frequency Sounder. The data are ordered chronologically. Telemetry stations are not identified, but satellite location, Greenwich mean time of observation, solar zenith angle at the satellite, dip latitude at the satellite, total electron content down to the lowest height of topside signal reflection (normally near 300 km), and other relevant information is noted with each profile. The format gives sequences of numbers for each point scaled from the ionogram. These sequences include electron density at the successive points, and the coefficients a2, b3, b4, b5, etc. from which geometric heights can be calculated, using formulas 40 and 41 in J. E. Jackson, "The reduction of topside ionograms to electron-density profiles," Proceedings of the IEEE., p. 960, June 1969. These formulas can also be used to calculate interpolated density-height values. A CRC interpolation program (available at NSSDC) can be used with this data set.
Format Description (ASCII):
+------------------------------------------------+
| M | I5 | number of records |
+------------------------------------------------+
each record consists of a header and then the electron density profile data
HEADER:
+------------------------------------------------+
|itype | I1 | spacecraft identifier |
|iquality | I2 | quality index* |
|date | I6 | yddd year and day of year |
|time | I6 | hhmmss hour minutes and seconds |
|long | F6.1 | longitude in degrees |
|lat | F6.2 | latitude in degrees |
|dip | F6.2 | magnetic inclination (IGRF) |
|L | F5.2 | L value |
|xhi | F6.1 | solar zenith angle at 100 km |
|Rz12 | I3 | 12-month-running mean of sunspot number |
|IG12 | I3 | 12-month-running mean of IG index |
|rtec | F6.2 | TEC found in data set (units?) |
|ln(NmF2) | F7.4 | IRI value for F2 peak in cm-3 |
|hmF2 | F5.1 | IRI value for F2 peak height in km |
|TEC_IRI | F6.2 | IRI value for TEC in TECU |
|n | I3 | number of data points |
+------------------------------------------------+
(*) Quality index ranges from 0 (best) to 10 (worst), actually 4 to 10 for these
data sets, with a most likely value of 6.
PROFILE DATA:
+---------------------------------------+
|n height values: | 14I5 | h/km*10 |
|n density values: | 10I7 | ln(Ne/cm-3)*100000 |
+---------------------------------------+
starting with the highest value (satellite height).
本数据集由加拿大渥太华的通信研究中心(Communications Research Centre, CRC)提供,包含F2层峰值高度以上的电离层(顶侧电离层,topside ionosphere)电子密度廓线。这些数据由频率与虚高的数字化数值计算得到,数值源自ISIS 2(国际电离层研究卫星,International Satellites for Ionospheric Studies)扫频测高仪所测得的电离层图(ionogram)的标定量值。数据按时间顺序排列。本数据集未标识遥测站,但每条廓线均附带卫星位置、观测的格林尼治平均时间、卫星处的太阳天顶角、卫星处的磁倾角、顶侧信号反射最低高度(通常接近300 km)以下的总电子含量,以及其他相关信息。
数据格式为每条记录提供源自电离层图标定量值的数值序列,该序列包含各测点的电子密度,以及系数a₂、b₃、b₄、b₅等,可借助J.E.杰克逊1969年6月发表于《电气与电子工程师协会会刊(Proceedings of the Institute of Electrical and Electronics Engineers, IEEE)》第960页的论文《顶侧电离层图归化为电子密度廓线》中的公式40与41计算得到几何高度。上述公式亦可用于计算插值得到的密度-高度数值。本数据集可配合加拿大通信研究中心开发的插值程序(可从美国国家空间科学数据中心,National Space Science Data Center, NSSDC获取)使用。
### 格式说明(ASCII格式):
+------------------------------------------------+
| 字段类型 | 格式 | 说明 |
+------------------------------------------------+
| M | I5 | 记录总数 |
+------------------------------------------------+
每条记录由表头与电子密度廓线数据组成。
#### 表头部分:
+------------------------------------------------+
| 字段名 | 格式 | 说明 |
+------------------------------------------------+
| itype | I1 | 航天器标识符 |
| iquality | I2 | 质量指数* |
| date | I6 | yddd格式:年和年积日 |
| time | I6 | hhmmss格式:时、分、秒 |
| long | F6.1 | 经度(单位:度) |
| lat | F6.2 | 纬度(单位:度) |
| dip | F6.2 | 磁倾角(国际地磁参考场,International Geomagnetic Reference Field, IGRF) |
| L | F5.2 | L参数 |
| xhi | F6.1 | 100 km高度处的太阳天顶角 |
| Rz12 | I3 | 太阳黑子数12个月滑动平均值 |
| IG12 | I3 | IG指数12个月滑动平均值 |
| rtec | F6.2 | 数据集中的总电子含量(单位待明确) |
| ln(NmF2) | F7.4 | 国际参考电离层(International Reference Ionosphere, IRI)给出的F2层峰值电子密度自然对数,单位:cm⁻³ |
| hmF2 | F5.1 | 国际参考电离层(International Reference Ionosphere, IRI)给出的F2层峰值高度,单位:km |
| TEC_IRI | F6.2 | 国际参考电离层(International Reference Ionosphere, IRI)给出的总电子含量,单位:总电子含量单位(Total Electron Content Unit, TECU) |
| n | I3 | 数据点数 |
+------------------------------------------------+
* 质量指数取值范围为0(最优)至10(最差),本数据集的质量指数实际介于4至10之间,最常见取值为6。
#### 廓线数据部分:
+---------------------------------------+
| 数据项 | 格式 | 说明 |
+---------------------------------------+
| 高度值共n个 | 14I5 | 高度值为实际高度/km×10 |
| 电子密度值共n个 | 10I7 | 电子密度自然对数ln(Nₑ/cm⁻³)×100000 |
+---------------------------------------+
数据序列以最高高度(即卫星轨道高度)为起始。
创建时间:
2024-02-28
搜集汇总
数据集介绍
背景与挑战
背景概述
该数据集由加拿大通信研究中心提供,包含ISIS 2卫星测量的顶部电离层电子密度剖面数据,时间跨度为1971年至1979年,覆盖地球电离层、极区等多个区域。数据按时间顺序排列,每条记录包含卫星位置、观测时间、太阳天顶角等头部信息以及电子密度剖面,提供ASCII和CDF格式,可通过FTPS、HTTPS等多种方式开放访问。
以上内容由遇见数据集搜集并总结生成


