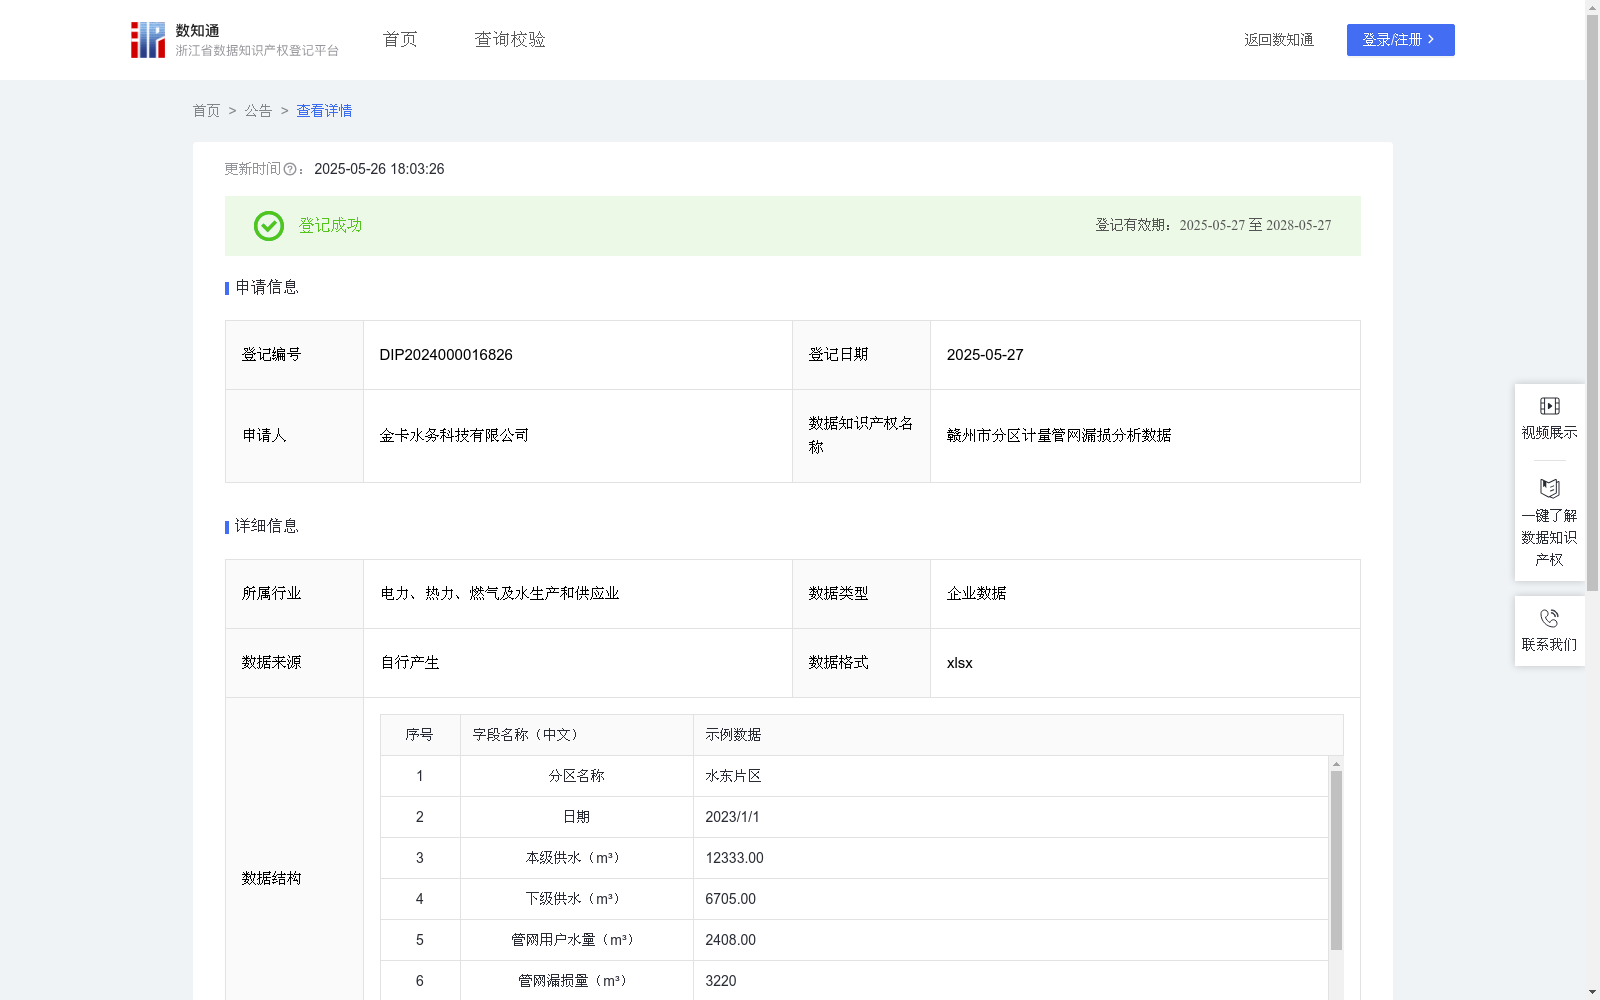
赣州市分区计量管网漏损分析数据
收藏资源简介:
对供水管网中主干管网漏损进行分析,剔除下级分区内的漏损,计算分区之间管网漏损率,通过管网漏损率的变化,发现主干管网中出现的新增漏损,及时控漏,为城市供水公司提供精准的漏损定位服务,缩小漏损检测范围,提高降漏效率,减少无效人力投入。1、数据获取 通过金卡物联网平台及漏损管控平台获取分区名称、日期、本级供水(m³)、下级供水(m³)、管网用户水量(m³)。 2、规则设定 根据分区水量平衡理论及主干管网漏损动态分析法,动态叠加本级供水(m³)、下级供水(m³)、管网用户水量(m³),计算每个分区的管网漏损量(m³)、管网漏损率(%),分析漏损变化趋势。 计算公式如下: ①管网漏损量(m)=本级供水(m³)-下级供水(m³)-管网用户水量(m³) ②管网漏损率(%)=管网漏损量(m³)/本级供水(m³) *100% ③昨日管网漏损率=前一天日期的 管网漏损率(%) ④变化量(%)=管网漏损率(%)-昨日管网漏损率(%) 3、结果输出 输出管网漏损率(%)、昨日管网漏损率(%)、变化量(%)>5,则输出结论为管网漏损,其余为正常。
This dataset is designed to analyze water leakage in the main pipeline network of urban water supply systems, exclude leakage within subordinate districts, calculate the pipe network leakage rate between districts, detect newly occurring leakage in the main pipeline network via changes in the leakage rate, enable timely leakage control, provide precise leakage location services for urban water supply companies, narrow the leakage detection scope, improve leakage reduction efficiency, and reduce ineffective labor investment. 1. Data Acquisition Relevant data including district names, dates, local water supply (m³), subordinate water supply (m³), and network user water consumption (m³) are collected through the JinKa IoT Platform and Leakage Control and Management Platform. 2. Rule Setting Based on the district water quantity balance theory and the dynamic analysis method for main pipeline network leakage, the three indicators of local water supply (m³), subordinate water supply (m³), and network user water consumption (m³) are dynamically utilized to calculate the pipe network leakage volume (m³) and pipe network leakage rate (%) of each district, and analyze the trend of leakage changes. The specific calculation formulas are as follows: ① Pipe network leakage volume (m³) = Local water supply (m³) - Subordinate water supply (m³) - Network user water consumption (m³) ② Pipe network leakage rate (%) = (Pipe network leakage volume (m³) / Local water supply (m³)) × 100% ③ Yesterday's pipe network leakage rate = The pipe network leakage rate (%) of the previous day ④ Change rate (%) = Pipe network leakage rate (%) - Yesterday's pipe network leakage rate (%) 3. Result Output The pipe network leakage rate (%), yesterday's pipe network leakage rate (%), and the change rate (%) are output. If the change rate (%) exceeds 5, the conclusion is marked as "pipe network leakage"; otherwise, it is determined as "normal".