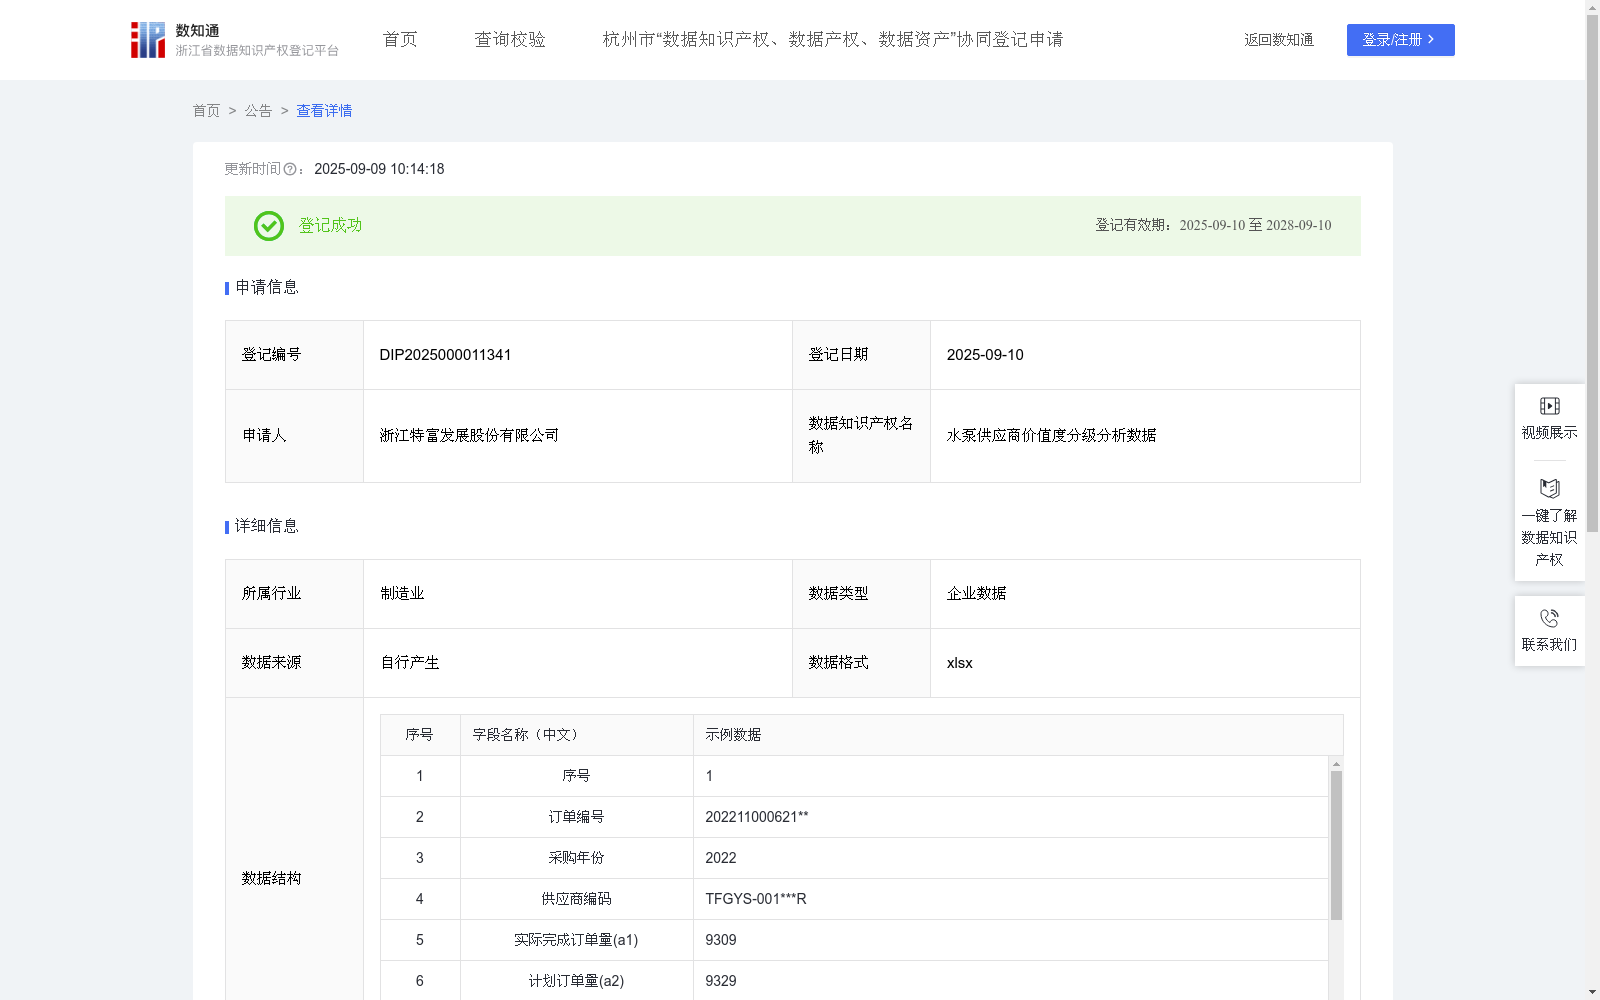
水泵供应商价值度分级分析数据
收藏资源简介:
水泵供应商协同管理以提升协同效率为核心目标,聚焦企业内外部协作,借助数据驱动优化全流程。 企业内部管控:集订单、生产、物流等数据,经处理后用协同效率指数区分供应商价值。战略级(E≥0.92)作为优质伙伴,深度绑定,优先分配高端定制订单,同时开放季度排产计划助力其提前备料、匹配产能;核心级(0.85≤E<0.92)持续深化合作,定向推送标准化订单,附加《协同改进任务包》,明确交付周期压缩、质量投诉率降低等可量化改进点,借协同系统自动追踪进度;合格级(0.7≤E<0.85)聚焦基础协同,推送通用标准化订单,同步签订《协同提升协议》,清晰界定交期、质量硬指标,系统按月生成监控报告并触发整改通知;待淘汰级(E<0.7)启动替代防御机制,阶梯式缩减订单占比,依历史订单数据智能筛选备选供应商,生成切换方案推动平稳替换 ,以此实现差异化、精细化的供应商管理。数据闭环迭代:每月更新协同效率指数,自动重评供应商等级,推动策略调整;对连续不达标供应商,系统筛选备选商、生成切换方案,助力企业高效决策,实现从分析到行动的闭环,提升产业链降本提效能力 。1.数据来源:数据采集与企业ERP以及运营系统中采集近3年水泵供应商的订单,对订单数据进行脱敏加工后进行处理。 2.数据处理:采集的数据包括有以下:a1代表实际完成订单量,反映订单执行的基础成果,数据来源于ERP系统;a2代表计划订单量,对比计划衡量交付达成率,数据来源于计划表;b1代表延迟交货天数,负向指标,转化为“准时率贡献”,数据来源于运营系统;b2代表总交付周期,分母标准化延迟的影响,数据来源于合同约定;c代表不良订单数量(质量问题),负向指标,转化为“质量达标率 ”,数据来源于运营凭条;d代表供应链信息共享度,数据来源于运营系统;还包括有z1、z2、z3和z4,分别代表权重系数,z1=0.31;z2=0.22;z3=0.27;z4=0.20,数据来源于专家评估。 3.数据分析:协同效率指数公式:E=z1*a1 /a2+z2*(1-b1/b2)+z3*(1-c/a1)+z4*log10(d+1),其中E为协同效率指数,log10在数学中以10为底的对数函数,通过采集到的输入量从而可计算出协同效率指数E值。根据协同效率指数E供应商进行分级:战略级(E≥0.92),核心级(0.85≤E<0.92),合格级(0.7≤E<0.85),待淘汰级(E<0.7),如E=0.94,则为战略级;E=0.86,则为核心级;E=0.81,则为合格级;E=0.69,则为待淘汰级。
Water pump supplier collaborative management takes improving collaborative efficiency as its core goal, focusing on internal and external enterprise collaboration and optimizing the entire workflow via data-driven methods. Internal enterprise control: Collect data such as orders, production, and logistics, and use the collaborative efficiency index to distinguish supplier value after data processing. - Strategic level (E ≥ 0.92): As high-quality partners with deeply integrated partnerships, they are prioritized for high-end customized orders, while quarterly production scheduling plans are disclosed to help them prepare materials in advance and match production capacity; - Core level (0.85 ≤ E < 0.92): Continue to deepen cooperation, targetedly push standardized orders, attach the "Collaborative Improvement Task Package" specifying quantifiable improvement points such as delivery cycle compression and quality complaint rate reduction, and automatically track progress via the collaborative system; - Qualified level (0.7 ≤ E < 0.85): Focus on basic collaboration, push general standardized orders, sign the "Collaborative Enhancement Agreement" simultaneously, clearly define hard indicators for delivery time and quality, and the system generates monthly monitoring reports and triggers rectification notifications; - Elimination-level (E < 0.7): Launch an alternative defense mechanism, gradually reduce the proportion of orders, intelligently screen alternative suppliers based on historical order data, and generate switching plans to promote smooth replacement, thereby realizing differentiated and refined supplier management. Data closed-loop iteration: Update the collaborative efficiency index monthly, automatically re-evaluate supplier levels and promote strategy adjustment; for suppliers that continuously fail to meet standards, the system screens alternative suppliers and generates switching plans to assist enterprises in efficient decision-making, realizing the closed-loop from analysis to action and improving the ability to reduce costs and increase efficiency in the industrial chain. 1. Data Source: Collect orders of water pump suppliers from the enterprise's ERP and operation systems over the past 3 years, and process the order data after desensitization processing. 2. Data Processing: The collected data includes the following: a1 represents the actual completed order volume, reflecting the basic results of order execution, with data sourced from the ERP system; a2 represents the planned order volume, used to measure the delivery achievement rate against the plan, with data sourced from the scheduling plan; b1 represents the number of delayed delivery days, a negative indicator converted into "on-time rate contribution", with data sourced from the operation system; b2 represents the total delivery cycle, used as the denominator to standardize the impact of delays, with data sourced from contract agreements; c represents the number of defective orders (quality issues), a negative indicator converted into "quality compliance rate", with data sourced from operation documents; d represents the supply chain information sharing level, with data sourced from the operation system; Also included are z1, z2, z3 and z4, which represent weight coefficients respectively, with z1=0.31; z2=0.22; z3=0.27; z4=0.20, and the data is derived from expert evaluations. 3. Data Analysis: Collaborative efficiency index formula: $E = z_1 cdot frac{a_1}{a_2} + z_2 cdot (1 - frac{b_1}{b_2}) + z_3 cdot (1 - frac{c}{a_1}) + z_4 cdot log_{10}(d+1)$, where E is the collaborative efficiency index, and $log_{10}$ refers to the base-10 logarithmic function in mathematics. The collaborative efficiency index E can be calculated using the collected input variables. Suppliers are classified based on the collaborative efficiency index E: Strategic level (E ≥ 0.92), Core level (0.85 ≤ E < 0.92), Qualified level (0.7 ≤ E < 0.85), Elimination-level (E < 0.7). For example, if E=0.94, the supplier is at the strategic level; if E=0.86, it is at the core level; if E=0.81, it is at the qualified level; if E=0.69, it is at the elimination level.