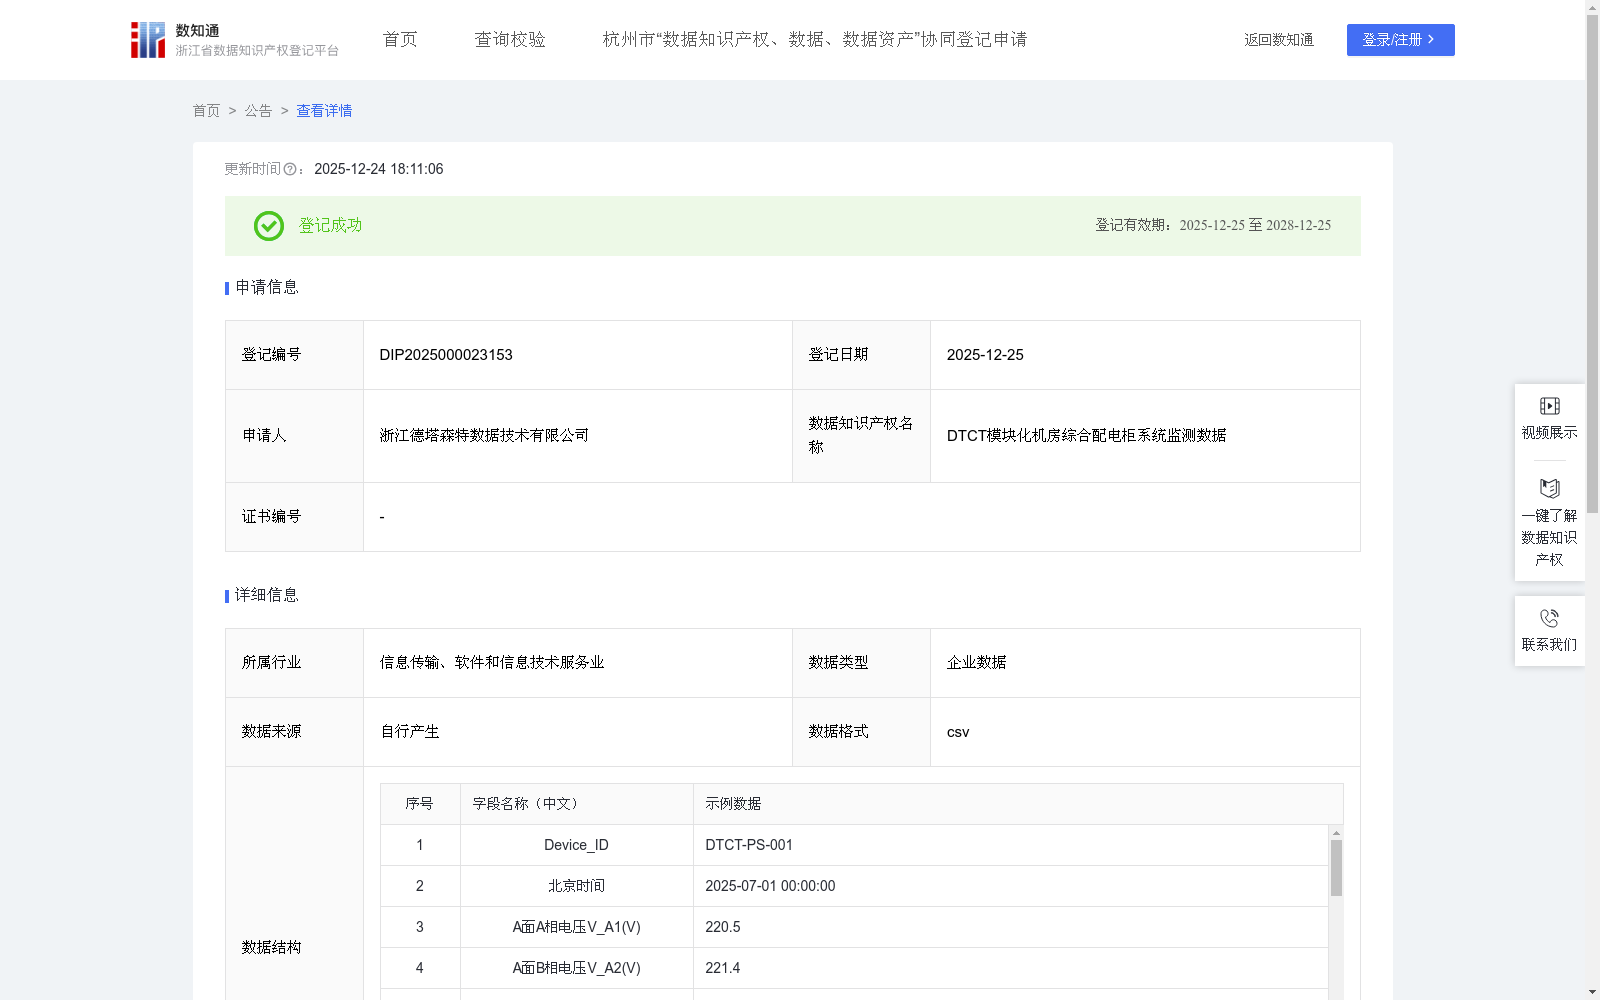
DTCT模块化机房综合配电柜系统监测数据
收藏资源简介:
通过监控和收集机房系统的电压、电流和功率相关数据,并计算电力质量指标和健康指数,能够提供早期故障预警、评估电能使用效率、优化资源分配,解决机房电压、电流和功率发生异常时,运维人员不能及时干预,导致停电或设备损坏的技术问题,提高能效。其中,功率因数(PF_A和PF_B)用于评估电能使用效率,负载率(Load_factor)优化资源分配,基于历史PSHI趋势,企业可制定预防性维护计划,减少意外停机。在数据中心行业,这些数据还可共享给合作伙伴,提供机房租用方的电力可靠性报告,增强客户信任。算法规则说明: 本规则用于机房电力监控数据处理,计算电力质量和系统健康指标。 1. 数据采集 采集A/B面进线数据:三相电压V_A1/V_A2/V_A3, V_B1/V_B2/V_B3 [V];三相电流I_A1/I_A2/I_A3, I_B1/I_B2/I_B3 [A];有功功率P_A/P_B [KW];无功功率Q_A/Q_B [kVar]。采样周期10秒,数据经异常值处理。 2. 算法规则 (1) 视在功率:S_A = sqrt(P_A^2 + Q_A^2) [kVA];S_B = sqrt(P_B^2 + Q_B^2) [kVA] (2) 功率因数:PF_A = P_A / S_A;PF_B = P_B / S_B (3) 电压不平衡度:V_A_avg = (V_A1 + V_A2 + V_A3) / 3;V_unb_A = max(|V_Ai - V_A_avg|) / V_A_avg × 100%,B面同理计算V_unb_B (4) 电流不平衡度:I_A_avg = (I_A1 + I_A2 + I_A3) / 3;I_unb_A = max(|I_Ai - I_A_avg|) / I_A_avg × 100%,B面同理计算I_unb_B (5) 系统负载率:Load_factor = (S_A + S_B) / 1000 × 100%,注:额定容量1000kVA (6) 系统健康指数:PSHI = 0.4(1-V_unb_avg/5%) + 0.4(1-I_unb_avg/10%) + 0.2(PF_avg)。其中: V_unb_avg = (V_unb_A + V_unb_B) / 2 I_unb_avg = (I_unb_A + I_unb_B) / 2 PF_avg = (PF_A + PF_B) / 2 根据PSHI值综合评估系统健康状态,PSHI评估标准:>0.9优秀,>0.8良好,>0.7需关注,≤0.7需检查。
By monitoring and collecting voltage, current and power-related data of the computer room system, and calculating power quality indicators and health indexes, this solution can provide early fault warning, evaluate power utilization efficiency, optimize resource allocation, and address the technical problem that operation and maintenance personnel cannot intervene in time when voltage, current and power abnormalities occur in the computer room, leading to power outages or equipment damage, thereby improving energy efficiency. Specifically, power factors (PF_A and PF_B) are used to evaluate power utilization efficiency, and the load factor (Load_factor) is used to optimize resource allocation. Based on the historical PSHI trend, enterprises can develop preventive maintenance plans to reduce unplanned downtime. In the data center industry, this data can also be shared with partners to provide power reliability reports for computer room tenants, thereby enhancing customer trust. Algorithm Rule Description: This rule is used for data processing of computer room power monitoring to calculate power quality and system health indicators. 1. Data Collection Collect incoming line data of panel A and B: three-phase voltages V_A1/V_A2/V_A3, V_B1/V_B2/V_B3 [V]; three-phase currents I_A1/I_A2/I_A3, I_B1/I_B2/I_B3 [A]; active power P_A/P_B [kW]; reactive power Q_A/Q_B [kVar]. The sampling period is 10 seconds, and the data is processed for outliers. 2. Algorithm Rules (1) Apparent Power: S_A = sqrt(P_A² + Q_A²) [kVA]; S_B = sqrt(P_B² + Q_B²) [kVA] (2) Power Factor: PF_A = P_A / S_A; PF_B = P_B / S_B (3) Voltage Unbalance Rate: V_A_avg = (V_A1 + V_A2 + V_A3) / 3; V_unb_A = (max(|V_Ai - V_A_avg|) / V_A_avg) × 100%. Calculate V_unb_B for panel B using the same method. (4) Current Unbalance Rate: I_A_avg = (I_A1 + I_A2 + I_A3) / 3; I_unb_A = (max(|I_Ai - I_A_avg|) / I_A_avg) × 100%. Calculate I_unb_B for panel B using the same method. (5) System Load Factor: Load_factor = (S_A + S_B) / 1000 × 100%. Note: The rated capacity is 1000 kVA. (6) System Health Index (PSHI): PSHI = 0.4(1 - V_unb_avg/5%) + 0.4(1 - I_unb_avg/10%) + 0.2(PF_avg). Where: V_unb_avg = (V_unb_A + V_unb_B) / 2; I_unb_avg = (I_unb_A + I_unb_B) / 2; PF_avg = (PF_A + PF_B) / 2. The system health status is comprehensively evaluated based on the PSHI value, with the PSHI evaluation criteria: >0.9 for Excellent, >0.8 for Good, >0.7 for Attention Required, and ≤0.7 for Inspection Required.