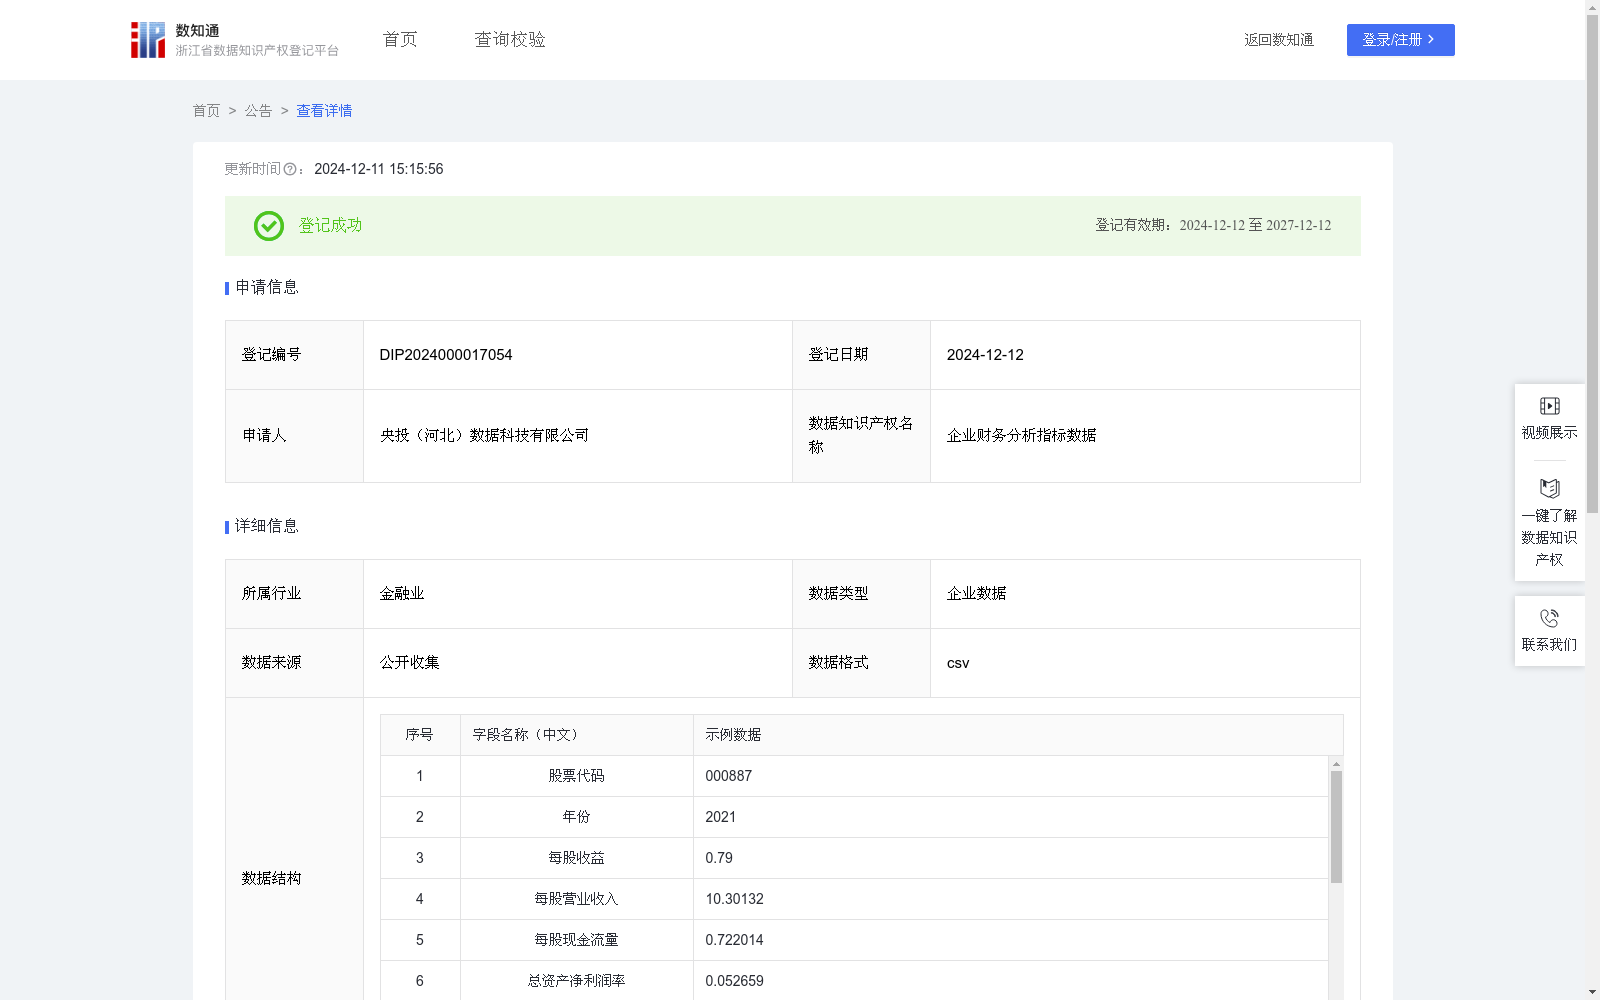
企业财务分析指标数据
收藏资源简介:
央投(河北)数据科技有限公司推出的“上市企业全景分析”系列,旨在为投资者和决策者提供全面、深入的上市公司数据资源。我们的Web软件通过先进的数据分析技术,对上市公司的财务表现、市场动态、企业信息等多维度数据进行综合处理与分析,提炼出关键指标,形成直观、准确的分析结果。这些数据不仅包括基础的财务数据,还涵盖了行业比较、市场趋势、风险评估等,为用户提供决策支持,帮助他们把握投资机会,优化资产配置。“上市企业全景分析”系列以其深度与广度,成为金融专业人士信赖的数据产品。"数据采集:从公开的金融信息平台和证券交易所收集上市公司的财务数据和市场表现数据,包括股票代码、公司全称、行业分类、财务报表等。 数据预处理:对采集的数据进行格式统一和错误修正,剔除或填补缺失值,对异常值进行检测和处理。所有个人和公共数据均进行匿名化和去标识化处理,确保数据的隐私保护。 描述性统计分析: 盈利能力评分:基于每股收益(EPS)、每股营业收入(Revenue Per Share)和每股现金流量(Cash Flow Per Share)计算得出。具体计算公式如下: 盈利能力评分= (EPS + RevenuePerShare + CashFlowPerShare) / 3 * 100 此评分反映公司的基本盈利能力,与行业平均水平进行比较。 财务健康分析: 财务健康指数:结合资产负债率(Debt to Asset Ratio)、净资产收益率(ROE)和总资产净利润率(ROA)计算得出。具体计算公式如下: 财务健康指数= (ROE + (ROA * 2) - DebtToAssetRatio) / 4 * 100 此指数反映公司的财务稳定性和偿债能力,权重考虑了资产负债率的较高影响。 投资吸引力评估: 投资吸引力指数:基于托宾Q值(Tobin's Q)、市净率(P/B Ratio)和市盈率(P/E Ratio)计算得出。具体计算公式如下: 投资吸引力指数= (TobinsQ + PBRatio + PERatio) / 3 * 100 此指数帮助评估公司对潜在投资者的吸引力,反映公司的市场估值和成长潜力。 结果验证与调整: 对生成的指标进行回测,验证其准确性和有效性。 根据回测结果和市场反馈,不断调整和优化算法模型。"
Launched by Yangtou (Hebei) Data Technology Co., Ltd., the "Listed Companies Comprehensive Analysis" series aims to provide comprehensive and in-depth listed company data resources for investors and decision-makers. Our web-based software leverages advanced data analysis technologies to comprehensively process and analyze multi-dimensional data including listed companies' financial performance, market dynamics, corporate information and more, extract key indicators, and generate intuitive and accurate analysis results. These data cover not only basic financial data, but also industry comparisons, market trends, risk assessments and other contents, providing decision support for users to help them seize investment opportunities and optimize asset allocation. The "Listed Companies Comprehensive Analysis" series has become a trusted data product among financial professionals due to its depth and breadth. Data Collection: Collect listed companies' financial data and market performance data from public financial information platforms and stock exchanges, including stock codes, full company names, industry classifications, financial statements and other relevant information. Data Preprocessing: Unify the format and correct errors of the collected data, eliminate or fill in missing values, and detect and handle abnormal values. All personal and public data are anonymized and de-identified to ensure data privacy protection. Descriptive Statistical Analysis: 1. Profitability Score: Calculated based on earnings per share (EPS), revenue per share, and cash flow per share. The specific calculation formula is as follows: Profitability Score = (EPS + Revenue Per Share + Cash Flow Per Share) / 3 * 100 This score reflects the company's basic profitability and is compared with the industry average level. 2. Financial Health Analysis: Financial Health Index: Calculated by combining debt to asset ratio, return on equity (ROE) and return on total assets (ROA). The specific calculation formula is as follows: Financial Health Index = (ROE + (ROA * 2) - Debt to Asset Ratio) / 4 * 100 This index reflects the company's financial stability and solvency, with weights considering the relatively high impact of the debt to asset ratio. 3. Investment Attractiveness Assessment: Investment Attractiveness Index: Calculated based on Tobin's Q, price-to-book ratio (P/B Ratio) and price-to-earnings ratio (P/E Ratio). The specific calculation formula is as follows: Investment Attractiveness Index = (Tobin's Q + P/B Ratio + P/E Ratio) / 3 * 100 This index helps evaluate the company's attractiveness to potential investors, reflecting the company's market valuation and growth potential. Result Verification and Adjustment: Backtest the generated indicators to verify their accuracy and effectiveness. Continuously adjust and optimize the algorithm model based on backtest results and market feedback.