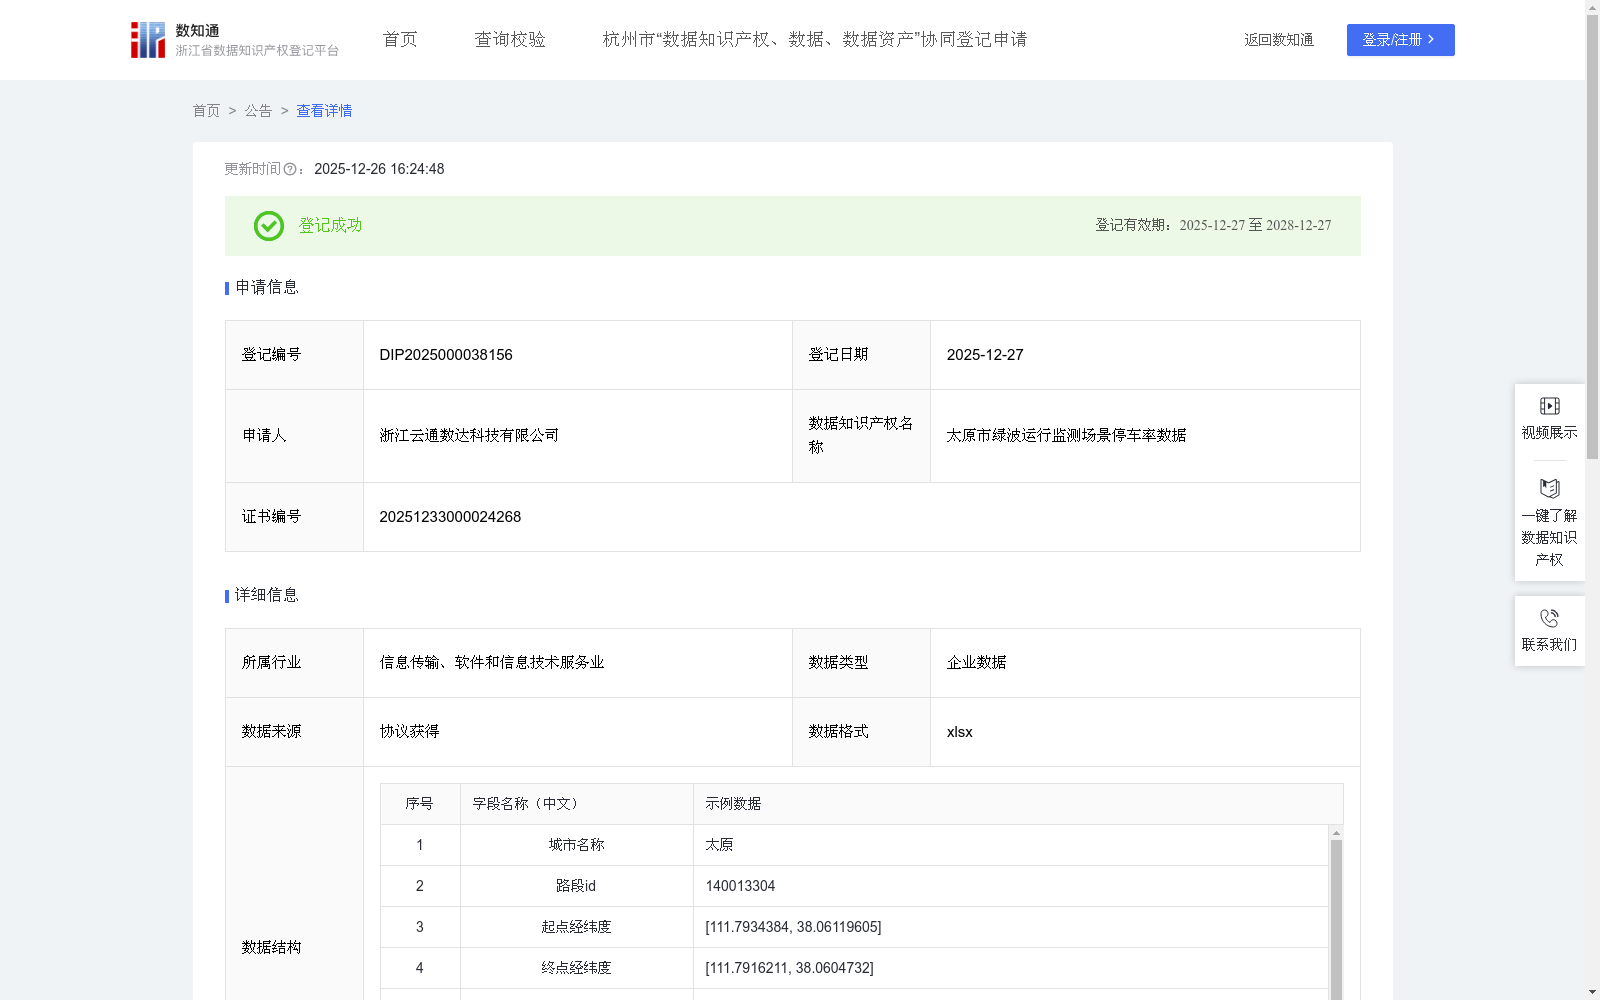
太原市绿波运行监测场景停车率数据
收藏资源简介:
该数据主要应用于太原市智能交通管理与信号灯优化场景。针对太原市内特定交通路段(通过路段ID标识),监测其在特定时间段内的通行状况。通过展示路段的车辆总数、停车数以及计算得出的停车率指标,量化反映该路段的交通拥堵程度与通行效率。停车率越高,该路段的拥堵程度越严重。 这一数据成果为交通管理部门提供了客观的决策依据,能够辅助评估路段的信号控制方案效果,及时发现异常拥堵节点,从而服务于路口信号配时的优化调整,提升城市道路整体通行能力。数据采集: 依托回传的交通流数据,采集原始的车辆通行记录与位置信息。采集范围覆盖太原市主要交通路段。 数据处理: 对原始数据进行清洗,去除重复、异常及缺失数据。对涉及车辆隐私的信息进行去标识化与脱敏处理,确保数据安全。 将处理后的数据进行结构化映射,明确每条数据的地理属性,包括城市名称、路段ID以及界定路段范围的起点经纬度和终点经纬度。 算法加工: 基于清洗后的数据进行时空聚合与统计计算,系统首先根据城市名称与路段ID,利用起点经纬度和终点经纬度划定具体的路段空间范围,并将数据按照精确的时间段(精确到小时的起止时间)进行切分聚合;接着,统计该时空范围内通行的车辆总数,并识别其中处于滞留或拥堵状态的停车数; 判断车辆停车状态算法的规则如下: 1.位置-距离转换:车辆定期上报的经纬度是地理坐标。我们采用 Haversine公式 进行球面三角学计算,将相邻两点的经纬度差值转换为地球表面的大圆直线距离(米)。该公式能有效修正地球曲率影响,比简单的平面欧氏距离更准确。 2.速度计算:获取上述两个位置点对应的时间戳,计算时间间隔(秒)。随后,用计算得到的位移距离除以时间间隔,即可得到这两个采样点之间的平均速度(米/秒)。 3.状态判定逻辑:设定一组基于实际场景和GPS定位误差(通常5-10米)的阈值进行判断: 4.停车状态:当计算出的连续速度值低于一个极小阈值(例如,0.1米/秒,约0.36公里/小时),并持续超过预设的时间窗口(如15秒),则判定为停车。单一低速点可能由GPS信号漂移导致,因此需要持续性条件来防误判。 (由于判断车辆停车状态算法涉及到每辆车的行驶数据,属于高敏感数据,所以并未在数据结构中展示。) 最后,采用比率计算模型,通过将停车数除以车辆总数计算得出停车率具体数值(即:停车率 = 停车数 / 车辆总数),从而形成量化反映路段通行效率与拥堵情况的结构化数据。
This dataset is mainly applied to the scenarios of intelligent traffic management and traffic signal optimization in Taiyuan City. For specific traffic road sections (identified by road section IDs) within Taiyuan, the traffic conditions during specific time periods are monitored. The total number of vehicles, the number of stopped vehicles, and the calculated stopping rate index of the road section are displayed to quantitatively reflect the traffic congestion level and traffic efficiency of the road section. The higher the stopping rate, the more severe the congestion of the road section. This dataset provides objective decision-making basis for traffic management departments, which can assist in evaluating the effectiveness of road section signal control schemes, timely detect abnormal congestion nodes, and thus serve the optimization and adjustment of intersection signal timing, improving the overall traffic capacity of urban roads. Data Collection: Rely on the returned traffic flow data to collect original vehicle travel records and location information. The collection scope covers major traffic road sections in Taiyuan City. Data Processing: Clean the original data to remove duplicate, abnormal and missing data. Perform de-identification and desensitization processing on vehicle privacy-related information to ensure data security. Perform structured mapping on the processed data to clarify the geographic attributes of each piece of data, including city name, road section ID, and the start and end longitude and latitude that define the road section range. Algorithm Processing: Perform spatiotemporal aggregation and statistical calculations based on the cleaned data. The system first delineates the specific spatial scope of the road section according to the city name and road section ID, using the start and end longitude and latitude, and splits and aggregates the data according to precise time periods (start and end times accurate to the hour); then, counts the total number of vehicles traveling within this spatiotemporal range, and identifies the number of stopped vehicles in a stagnant or congested state. The rules of the algorithm for judging vehicle stopping status are as follows: 1. Position-distance conversion: The longitude and latitude reported regularly by vehicles are geographic coordinates. We adopt the Haversine formula for spherical trigonometry calculations to convert the longitude and latitude difference between two adjacent points into the great circle straight-line distance (meters) on the Earth's surface. This formula can effectively correct the Earth's curvature effect and is more accurate than simple planar Euclidean distance. 2. Speed calculation: Obtain the timestamps corresponding to the two position points, calculate the time interval (in seconds). Then, divide the calculated displacement distance by the time interval to obtain the average speed (m/s) between the two sampling points. 3. State determination logic: Set a set of thresholds based on actual scenarios and GPS positioning errors (usually 5-10 meters) for judgment: 4. Stopping status: When the calculated continuous speed value is lower than a very small threshold (for example, 0.1 m/s, approximately 0.36 km/h) and lasts for a preset time window (such as 15 seconds), it is determined as stopping. A single low-speed point may be caused by GPS signal drift, so a continuous condition is required to avoid misjudgment. (Note: Since the vehicle stopping status judgment algorithm involves the driving data of each vehicle, which belongs to highly sensitive data, it is not displayed in the data structure.) Finally, use a ratio calculation model to calculate the specific value of the stopping rate by dividing the number of stopped vehicles by the total number of vehicles (i.e., Stopping Rate = Number of Stopped Vehicles / Total Number of Vehicles), thereby forming structured data that quantitatively reflects the road section's traffic efficiency and congestion status.