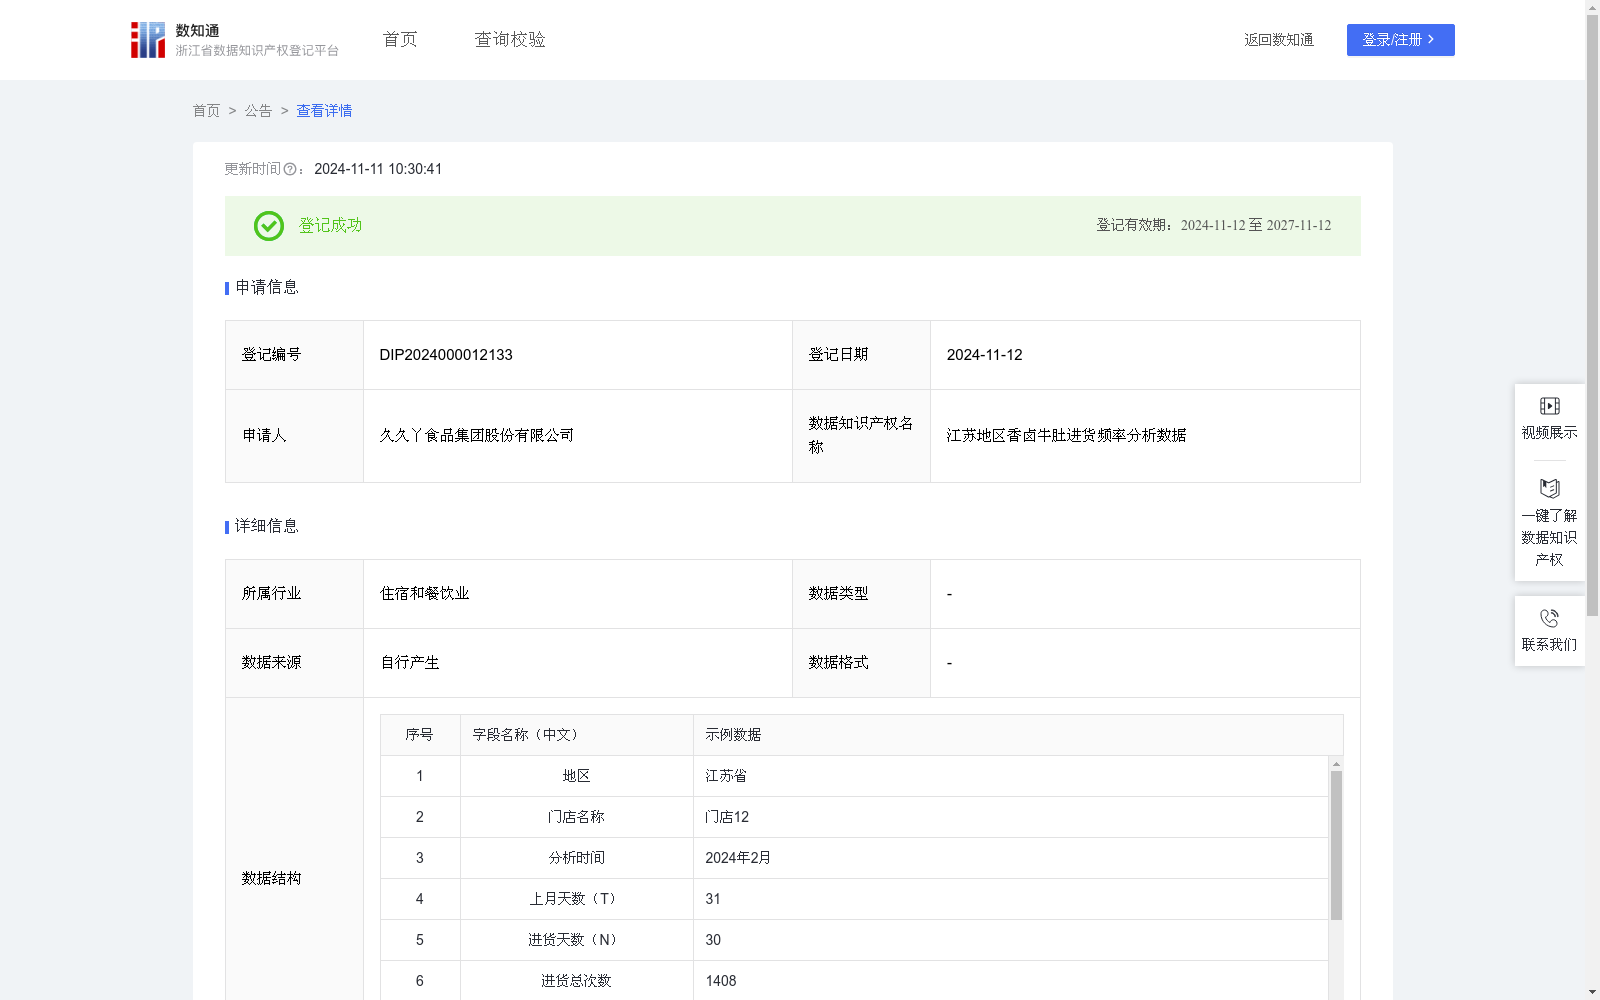
江苏地区香卤牛肚进货频率分析数据
收藏资源简介:
统计江苏地区各门店香卤牛肚一个月的进货次数,精确计算进货频率。供应商能据此洞悉门店需求差异,灵活调整库存分配与补货节奏,提升供应链响应速度。物流供应商则依据频率数据,科学规划配送路径,精准安排配送间,实现高效、低成本的物流运作。门店排名机制促使企业迅速识别运营瓶颈,及时干预改善。同时,比较各门店进货频率,企业能精准把握市场动态评估竞争态势,为制定差异化市场策略提供坚实数据支撑,推动整个产业链协同发展,增强市场竞争力。1、数据统计:采集江苏省每个门店一个月进货次数,对采集到数据进行分类、合并、累加,便于分析。2、数据分析:该时间段内的进货天数为N,上月天数 T。计算平均进货间隔时间 I=T/N,进货频率F=1/I。3、将进货频率进行排名,占比排名进货频率从大到小进行排名。4、根据进货频率排名,对门店等级进行“高、中、低”的评价,定义进货频率排名前5名的门店等级为“高”第6-10名的门店等级为“中”,第11名及以后的门店等级为“低”。
This dataset is designed to count the monthly purchase times of spiced marinated beef tripe for each store in Jiangsu Province and accurately calculate their purchase frequencies. Suppliers can thereby gain insights into demand differences across stores, flexibly adjust inventory allocation and replenishment rhythms, and improve supply chain response speed. Logistics suppliers can use the frequency data to scientifically plan delivery routes and precisely arrange delivery intervals, achieving efficient and low-cost logistics operations. The store ranking mechanism allows enterprises to quickly identify operational bottlenecks and take timely intervention measures for improvement. Meanwhile, by comparing the purchase frequencies of various stores, enterprises can accurately grasp market dynamics and assess competitive situations, providing solid data support for formulating differentiated market strategies, promoting the coordinated development of the entire industrial chain, and enhancing market competitiveness. 1. Data Statistics: Collect the monthly purchase count of each store in Jiangsu Province, then classify, merge and accumulate the collected data to facilitate subsequent analysis. 2. Data Analysis: Let the number of purchase days within the statistical period be N, and the number of days in the previous month be T. Calculate the average purchase interval I = T/N, and the purchase frequency F = 1/I. 3. Purchase Frequency Ranking: Rank the purchase frequencies of all stores in descending order from highest to lowest. 4. Store Tier Classification: Divide store tiers into "High", "Medium" and "Low" based on their purchase frequency rankings. Specifically, stores ranked within the top 5 are classified as the "High" tier, those ranked 6th to 10th as the "Medium" tier, and those ranked 11th and below as the "Low" tier.