
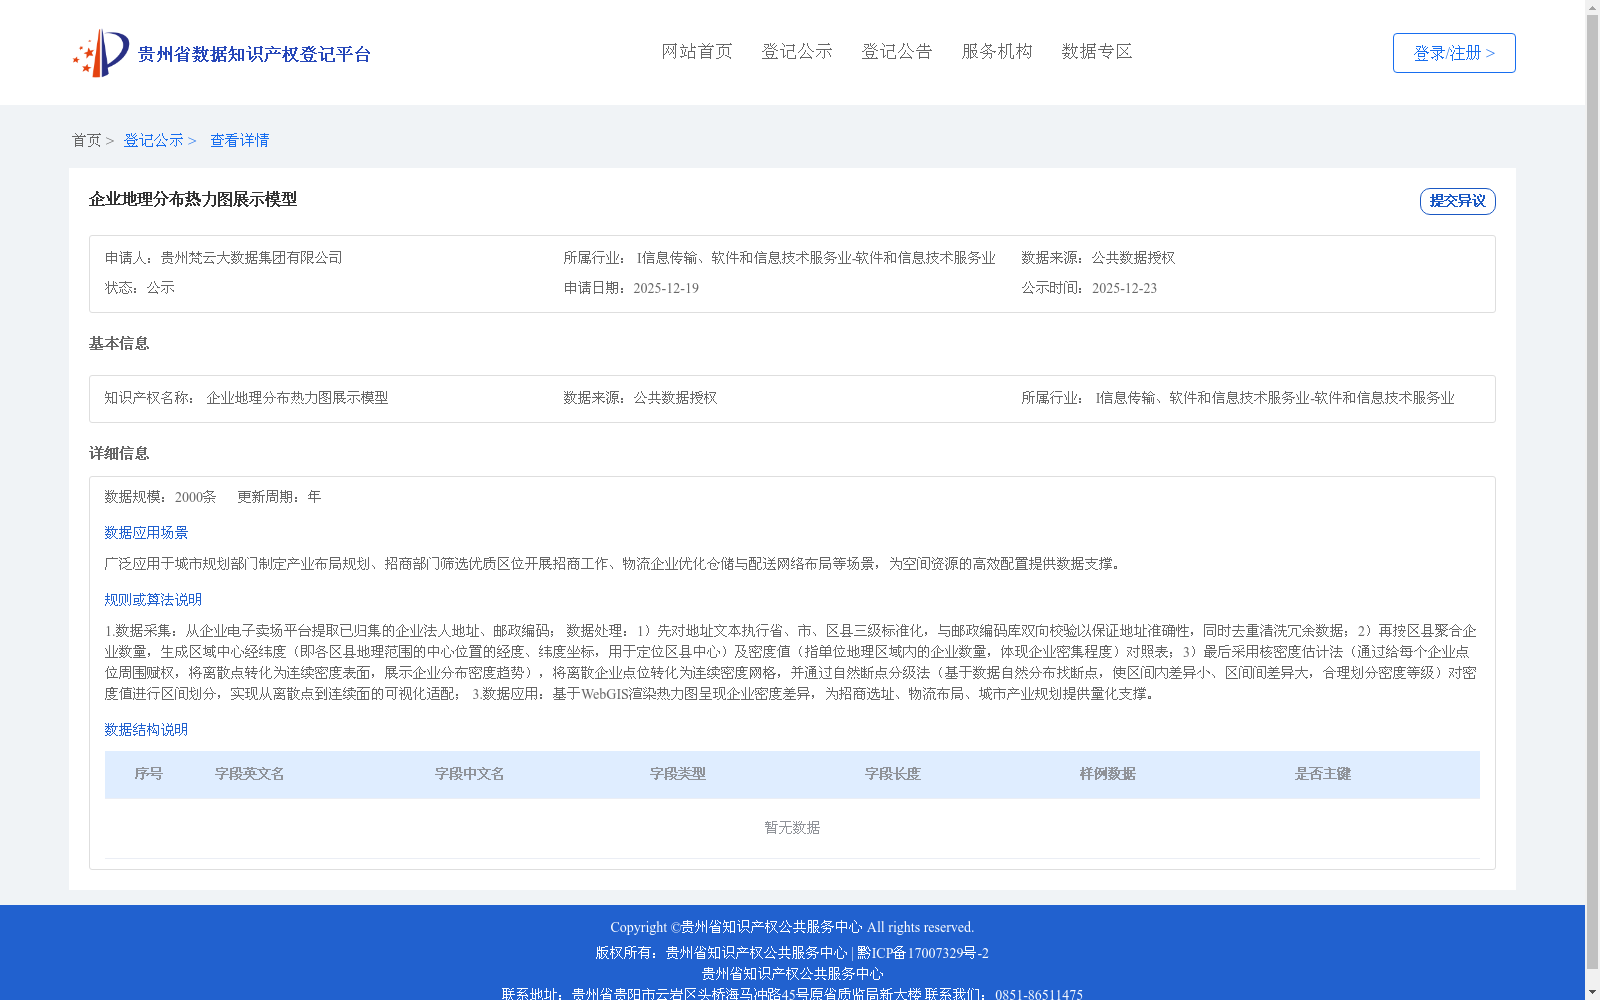
企业地理分布热力图展示模型
收藏贵州省数据知识产权登记平台2025-12-23 更新2025-12-24 收录
下载链接:
https://gzdipp.gzsis.cn:12020/noticeDetail?id=2040&type=1
下载链接
链接失效反馈官方服务:
资源简介:
1.数据采集:从企业电子卖场平台提取已归集的企业法人地址、邮政编码;
数据处理:1)先对地址文本执行省、市、区县三级标准化,与邮政编码库双向校验以保证地址准确性,同时去重清洗冗余数据;2)再按区县聚合企业数量,生成区域中心经纬度(即各区县地理范围的中心位置的经度、纬度坐标,用于定位区县中心)及密度值(指单位地理区域内的企业数量,体现企业密集程度)对照表;3)最后采用核密度估计法(通过给每个企业点位周围赋权,将离散点转化为连续密度表面,展示企业分布密度趋势),将离散企业点位转化为连续密度网格,并通过自然断点分级法(基于数据自然分布找断点,使区间内差异小、区间间差异大,合理划分密度等级)对密度值进行区间划分,实现从离散点到连续面的可视化适配;
3.数据应用:基于WebGIS渲染热力图呈现企业密度差异,为招商选址、物流布局、城市产业规划提供量化支撑。
1. Data Collection: Extract pre-collected legal entity addresses and zip codes of enterprises from the enterprise e-mall platform;
2. Data Processing: 1) First, conduct three-level standardization at the provincial, municipal, and district/county tiers for address texts, perform two-way verification with the zip code database to ensure address accuracy, and deduplicate and clean redundant data; 2) Next, aggregate enterprise counts by district/county, and generate a comparison table of regional center longitude and latitude coordinates (i.e., the longitude and latitude of the central point of each district/county's geographical scope, used to locate the district/county center) and density values (referring to the number of enterprises per unit geographical area, reflecting the intensity of enterprise clustering); 3) Finally, adopt Kernel Density Estimation (KDE), which assigns weights to the surrounding area of each enterprise location to convert discrete points into a continuous density surface and visualize the trend of enterprise distribution density, to convert discrete enterprise locations into continuous density grids. Then use the Natural Breaks Classification Method, which identifies breakpoints based on the natural data distribution to minimize intra-interval differences and maximize inter-interval differences for reasonable density level division, to divide density values into intervals, enabling visualization adaptation from discrete points to continuous surfaces;
3. Data Application: Render heatmaps via WebGIS to display the differences in enterprise density, providing quantitative support for investment attraction and site selection, logistics layout, and urban industrial planning.
提供机构:
贵州梵云大数据集团有限公司创建时间:
2025-12-19
搜集汇总
数据集介绍
背景与挑战
背景概述
该数据集是一个基于公共数据构建的企业地理分布热力图展示模型,包含2000条数据并每年更新。它通过地址标准化和核密度估计算法,将离散企业点位转化为连续密度网格,广泛应用于城市规划、招商选址和物流网络优化等场景,为空间资源配置提供量化支撑。
以上内容由遇见数据集搜集并总结生成


