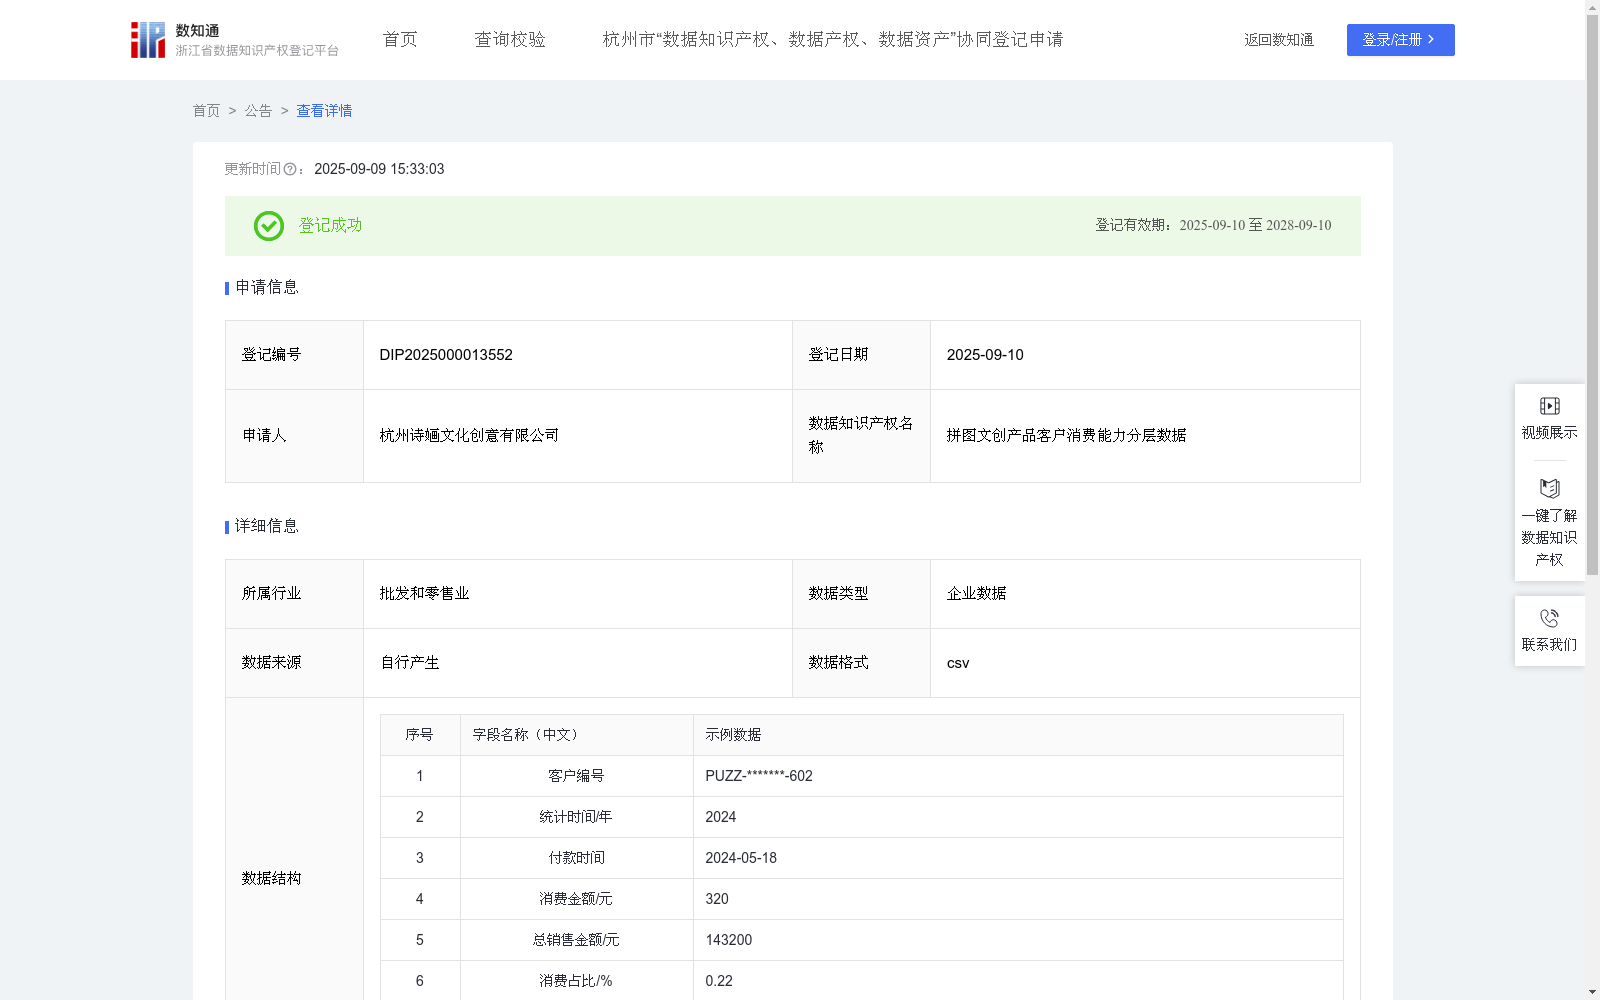
拼图文创产品客户消费能力分层数据
收藏资源简介:
本数据通过对拼图文创产品客户的购买行为与使用特征进行分析,构建客户消费能力分层模型,呈现不同客户群体在购买频次、品类偏好及复购稳定性方面的差异。在此基础上,进一步反映各层级客户在消费习惯、主题倾向及互动特征上的表现。该分层结果有助于文创品牌方、销售平台及相关合作方了解客户结构的多样性,识别不同群体的行为特征与参与程度,为产品展示、内容触达和服务配置提供基础数据支持,增强对用户需求结构的整体认知。1.数据收集:收集购买拼图文创产品客户的消费数据,根据客户消费能力梳理数据,具体包括:客户编号、统计时间/年、付款时间、消费金额/元等字段。 2.总销售金额计算:用Group函数以统计时间为分组,计算每年的销售总金额。总销售金额=SUM(每条数据的消费金额字段)。 3.消费占比计算:消费占比=消费金额 / 总销售金额 * 100%。 4.消费占比降序排列,运用ABCDEF分类法: 消费占比≥1%,给予“A类消费”分层; 1%>消费占比≥0.8%,给予“B类消费”分层; 0.8%>消费占比≥0.6%,给予“C类消费”分层; 0.6%>消费占比≥0.4%,给予“D类消费”分层; 0.4%>消费占比≥0.2%,给予“E类消费”分层; 0.2%>消费占比,给予“F类消费”分层。 3、数据应用:通过这样的分析流程,企业不仅能够更准确地把握市场动态,还能够有效提升客户满意度和市场竞争力。
This dataset analyzes the purchase behavior and usage characteristics of customers who purchased jigsaw puzzle cultural and creative products, and constructs a customer consumption capacity stratification model to demonstrate the differences among different customer groups in terms of purchase frequency, category preference, and repurchase stability. On this basis, it further reflects the performance of customers at each stratification level in terms of consumption habits, theme preferences, and interaction characteristics. This stratification result helps cultural and creative brand operators, sales platforms and relevant partners understand the diversity of customer structures, identify the behavioral characteristics and participation levels of different groups, provide basic data support for product display, content outreach and service configuration, and enhance the overall perception of user demand structure. 1. Data Collection: Collect consumption data of customers who purchased jigsaw puzzle cultural and creative products, and organize the data based on customer consumption capacity. The specific fields include: customer ID, statistical time/year, payment time, consumption amount (yuan), etc. 2. Total Sales Amount Calculation: Use the Group function to group by statistical time, and calculate the total annual sales amount. Total Sales Amount = SUM (consumption amount field of each data entry). 3. Consumption Proportion Calculation: Consumption Proportion = (Consumption Amount / Total Sales Amount) * 100%. 4. Classification Using ABCDEF Method: Sort the consumption proportion in descending order, and perform stratification as follows: - Stratified as "Class A Consumption" when consumption proportion ≥ 1%; - Stratified as "Class B Consumption" when 1% > consumption proportion ≥ 0.8%; - Stratified as "Class C Consumption" when 0.8% > consumption proportion ≥ 0.6%; - Stratified as "Class D Consumption" when 0.6% > consumption proportion ≥ 0.4%; - Stratified as "Class E Consumption" when 0.4% > consumption proportion ≥ 0.2%; - Stratified as "Class F Consumption" when consumption proportion < 0.2%. 3. Data Application: Through such an analysis process, enterprises can not only accurately grasp market trends, but also effectively improve customer satisfaction and market competitiveness.