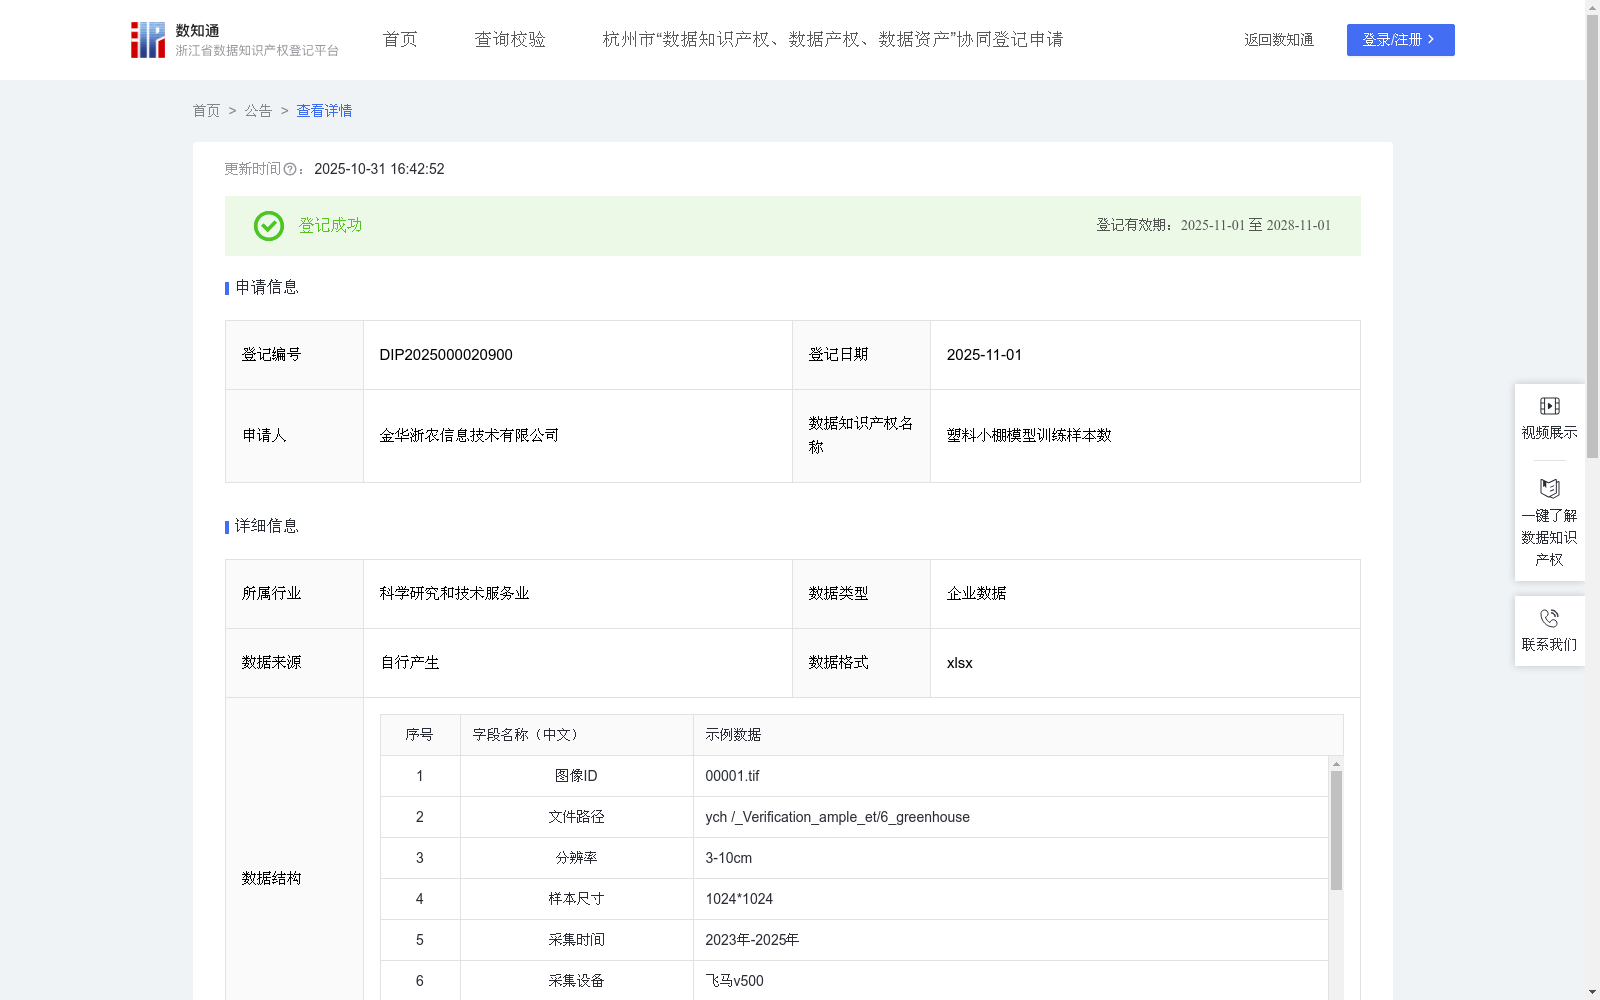
塑料小棚模型训练样本数
收藏资源简介:
1现代农业管理与政策精准实施:设施农业(塑料小棚种植)面积精准统计与动态监测;农业补贴精准发放核查 (如设施农业补贴、塑料小棚保险);种植结构调整 政策执行效果评估;小棚建设合规性监管(耕地用途管制)。提供客观、高效的小棚“底图”和变化证据,极大提升农业行政管理效率和政策落地的精准度、公平性,知识产权是支撑此类政府数据服务采购与合规应用的基础。2设施农业规划与资源优化:区域设施农业发展规划与布局优化;小棚产业集群发展态势分析;水土资源利用效率评估(结合灌溉设施识别);闲置小棚资源盘活引导。为政府宏观决策和市场主体投资提供空间数据支撑,促进设施农业资源高效配置与产业健康发展。知识产权明晰有利于数据在规划咨询、市场研究领域的授权应用。3农业面源污染防控与环境保护:监测废弃农膜 (来自塑料小棚)的回收情况与残留分布;评估小棚集中区对周边环境(土壤、水体)的潜在影响;服务于“白色污染”治理成效考核。精准锁定农膜污染源和治理重点区域,为环保监管提供靶向性数据支持。知识产权保护激励对环保监测数据的持续投入与创新应用。1、数据采集:利用飞马v500无人机,利用自动拼图得到1cm-3cm分辨率的无人机正射影像数据,并设置CGCS2000 / 3°投影坐标系,影像分辨率以及影像坐标系等参数同步加入至影像数据中。 2、数据预处理以及数据标注:首先,选择适用于样本的影像,明确裁切区域并绘制范围矢量;利用矢量数据裁切影像,采用在线标记点位并添加作物属性的方式,以点位为中心点进行裁剪,生成指定尺寸(如256*256)的影像切片。 3、数据集设置以及模型选择:按照7:2:1的比例设置训练集、验证集和测试集。使用自行搭建的TransCNN-Vision模型进行训练。 5、训练设置:模型选择与初始化以vision_transformer的large模型为权重文件,初始化常规模型参数后,读取数据集文件夹个数确定模型分类数,最优学习率为0.001,同时冻结出head和pre_logits外的所有权重参数,batchsize,根据当前设备现存余量自动调整,默认值为16,根据样本分辨率动态调整patch_size用于提高不同分辨率下的特征捕获能力。最后利用自适应高精度模型保存策略,自动保存训练精度mDice(Mean Dice Coefficient)指标最高模型的模型作为最佳模型。mDice计算公式如下: mDice=2*|X∩Y|/(|X|+|Y|)。 训练mDice指数基于对测试集样本数据预测并计算获得,其中|X∩Y|为预测结果与真实标注的交集,| X |和| Y |分别为预测结果与真实标签的各自的数量之和。 5、模型精度评估:通过在真实影像中进行模型提取并人工校正,实现对模型在真实场景中的提取效果。利用提取错误率和提取遗漏率指标来评估被识别物模型的提取能力,提取错误率用于评估模型提取结果中不是合理的比例,提取遗漏率用于评估模型提取结果依然没有提取出被识别物的比例,提取遗漏率越接近4.2%,提取错误率越接近6.2%,表明当前提取结果准确率越高,能够降低的成本越高。提取错误率计算公式如下:(|X|-|X∩Y|)/|X|。 提取遗漏率计算公式如下:(|Y|-|X∩Y|)/|Y|。其中,|X∩Y|为正确识别为被识别物的数量,| X |和| Y |分别为预测和真实的被识别数量。考虑到真实场景的复杂性,提取错误率和提取遗漏率保持在10%以内即可视为结果具有较高的准确性。
1. Precision Modern Agricultural Management and Policy Implementation: Accurate area statistics and dynamic monitoring of protected agriculture (plastic mini-shed cultivation); accurate verification and distribution of agricultural subsidies (e.g., protected agriculture subsidies, plastic mini-shed insurance); effectiveness evaluation of policy implementation for planting structure adjustment; compliance supervision of mini-shed construction (cultivated land use regulation). Providing objective and efficient "base maps" and change evidence for mini-sheds, which greatly enhances the efficiency of agricultural administrative management and the accuracy and fairness of policy implementation. Intellectual property rights are the foundation for supporting such government data service procurement and compliant applications. 2. Protected Agriculture Planning and Resource Optimization: Regional development planning and layout optimization of protected agriculture; analysis of development trends of mini-shed industrial clusters; evaluation of water and soil resource utilization efficiency (combined with irrigation facility identification); guidance on revitalizing idle mini-shed resources. Providing spatial data support for government macro decision-making and market entity investment, promoting efficient allocation of protected agricultural resources and healthy industrial development. Clear intellectual property rights facilitate authorized applications of data in planning consultation and market research fields. 3. Agricultural Non-Point Source Pollution Prevention and Environmental Protection: Monitoring the recycling status and residual distribution of waste agricultural film (from plastic mini-sheds); evaluating the potential impact of concentrated mini-shed areas on the surrounding environment (soil, water body); serving the assessment of "white pollution" treatment effectiveness. Accurately locking agricultural film pollution sources and key treatment areas, providing targeted data support for environmental supervision. Intellectual property protection incentives drive continuous investment and innovative applications of environmental monitoring data. 1. Data Collection: Using the Feima V500 UAV, obtain 1cm-3cm resolution UAV orthophoto data via automatic mosaic. Adopt the CGCS2000 / 3° projected coordinate system, and synchronize parameters such as image resolution and coordinate system into the image data. 2. Data Preprocessing and Annotation: First, select suitable images, define the cropping area and draw the range vector; crop the image using the vector data, adopt the method of marking points online and adding crop attributes, crop with the point as the center to generate image slices of specified dimensions (e.g., 256*256). 3. Dataset Setup and Model Selection: Set the training set, validation set and test set at a ratio of 7:2:1. Use the self-built TransCNN-Vision model for training. 5. Training Settings: Initialize the conventional model parameters using the weights of the vision transformer large model as pre-trained weights. Determine the number of model classification categories by reading the number of dataset folders. The optimal learning rate is 0.001. Freeze all weight parameters except head and pre_logits. The batch size is automatically adjusted according to the remaining memory of the current device, with a default value of 16. Dynamically adjust the patch_size based on the sample resolution to improve feature capture capability under different resolutions. Finally, use an adaptive high-precision model saving strategy to automatically save the model with the highest training mDice (Mean Dice Coefficient) indicator as the best model. The calculation formula of mDice is as follows: mDice=2*|X∩Y|/(|X|+|Y|). The training mDice index is obtained by predicting and calculating the test set sample data, where |X∩Y| is the intersection of the prediction results and the ground truth annotations, and |X| and |Y| are the total number of prediction results and ground truth labels respectively. 5. Model Accuracy Evaluation: Extract and manually correct the model in real images to evaluate the extraction effect of the model in real scenarios. Use the extraction error rate and extraction omission rate indicators to evaluate the extraction capability of the identified target model. The extraction error rate is used to evaluate the proportion of unreasonable results in the model extraction results, and the extraction omission rate is used to evaluate the proportion of identified objects that are not extracted in the model extraction results. The closer the extraction omission rate is to 4.2% and the extraction error rate is to 6.2%, the higher the accuracy of the current extraction results and the greater the cost reduction. The calculation formula of the extraction error rate is as follows: (|X|-|X∩Y|)/|X|. The calculation formula of the extraction omission rate is as follows: (|Y|-|X∩Y|)/|Y|. Where |X∩Y| is the number of correctly identified target objects, and |X| and |Y| are the predicted and actual number of target objects respectively. Considering the complexity of real scenarios, keeping the extraction error rate and extraction omission rate within 10% is considered as a result with high accuracy.