油/电车占比分析模型
收藏资源简介:
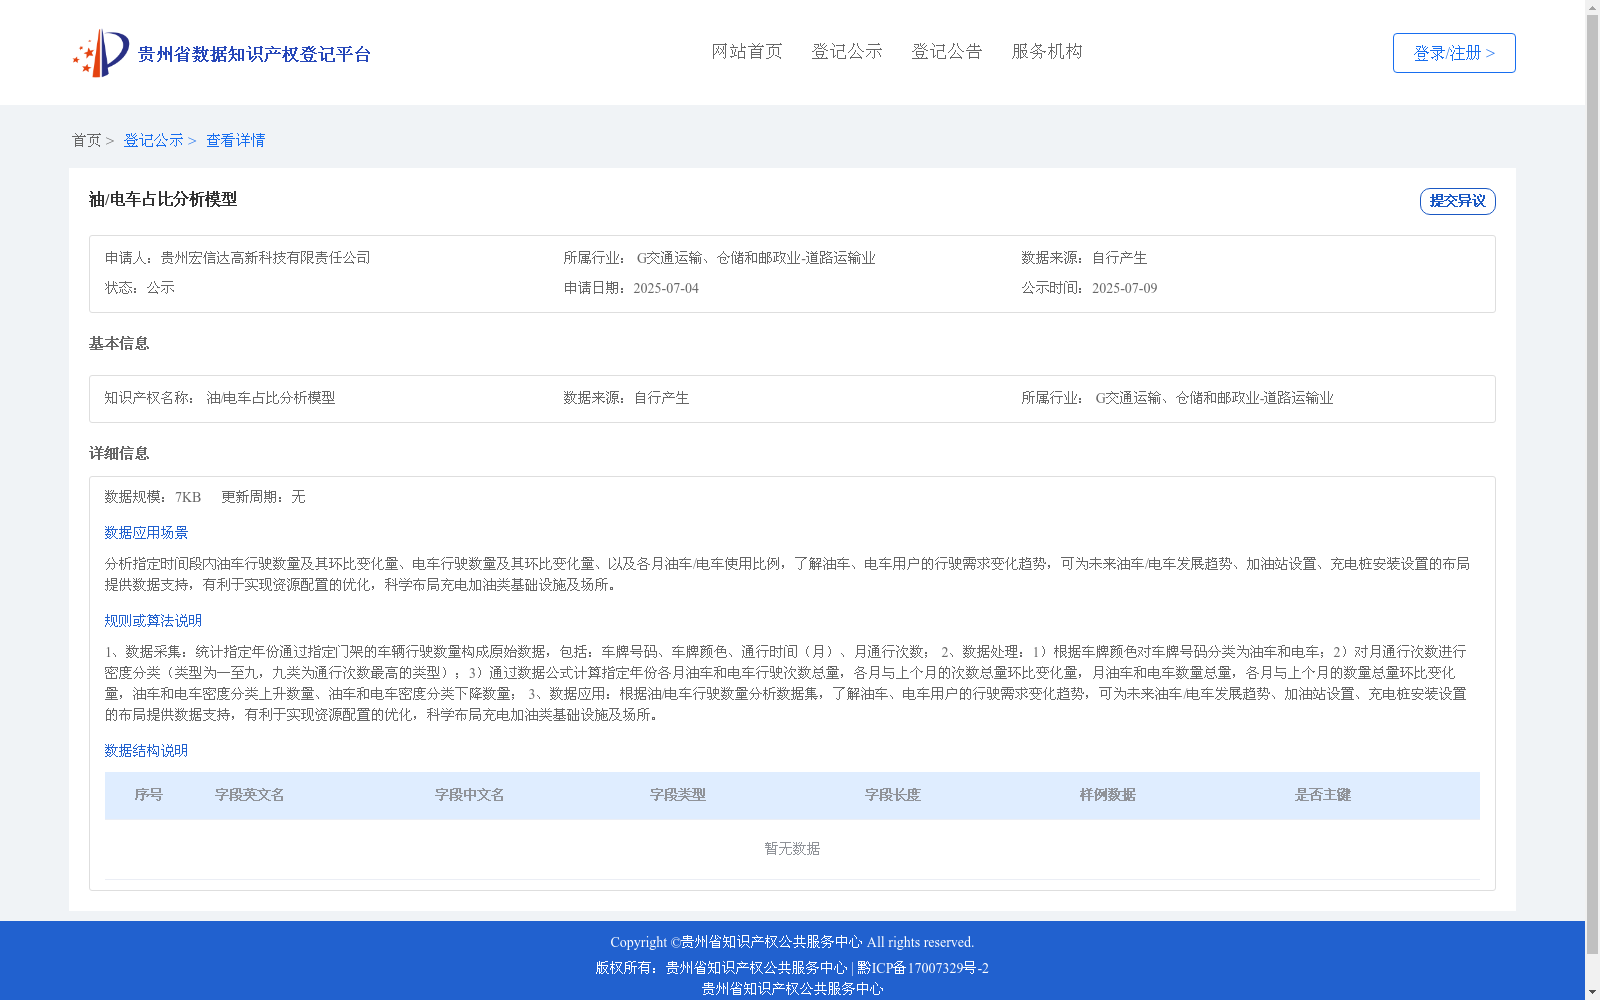
1、数据采集:统计指定年份通过指定门架的车辆行驶数量构成原始数据,包括:车牌号码、车牌颜色、通行时间(月)、月通行次数; 2、数据处理:1)根据车牌颜色对车牌号码分类为油车和电车;2)对月通行次数进行密度分类(类型为一至九,九类为通行次数最高的类型);3)通过数据公式计算指定年份各月油车和电车行驶次数总量,各月与上个月的次数总量环比变化量,月油车和电车数量总量,各月与上个月的数量总量环比变化量,油车和电车密度分类上升数量、油车和电车密度分类下降数量; 3、数据应用:根据油/电车行驶数量分析数据集,了解油车、电车用户的行驶需求变化趋势,可为未来油车/电车发展趋势、加油站设置、充电桩安装设置的布局提供数据支持,有利于实现资源配置的优化,科学布局充电加油类基础设施及场所。
1. Data Collection: Raw data is compiled from the number of vehicles passing through designated toll gantries in a specified year, including license plate number, license plate color, passage month, and monthly passage counts. 2. Data Processing: 1) Classify license plates into fuel-powered vehicles and electric vehicles based on their license plate colors; 2) Conduct density classification on monthly passage counts, with a total of 9 categories, where Category 9 represents the group with the highest passage counts; 3) Calculate via data formulas: the total monthly passage counts of fuel-powered and electric vehicles in the specified year, the month-on-month change in total passage counts between each month and the previous month, the total monthly quantity of fuel-powered and electric vehicles, the month-on-month change in total vehicle quantity between each month and the previous month, the number of vehicles in ascending density categories for fuel-powered and electric vehicles, and the number of vehicles in descending density categories for fuel-powered and electric vehicles. 3. Data Application: Analyze the dataset based on the passage quantities of fuel-powered and electric vehicles to understand the changing trends of travel demands of fuel-powered and electric vehicle users. This analysis can provide data support for predicting the future development trends of fuel-powered and electric vehicles, as well as the layout of gas stations and charging facilities, which is conducive to optimizing resource allocation and scientifically arranging refueling and charging infrastructure and related sites.