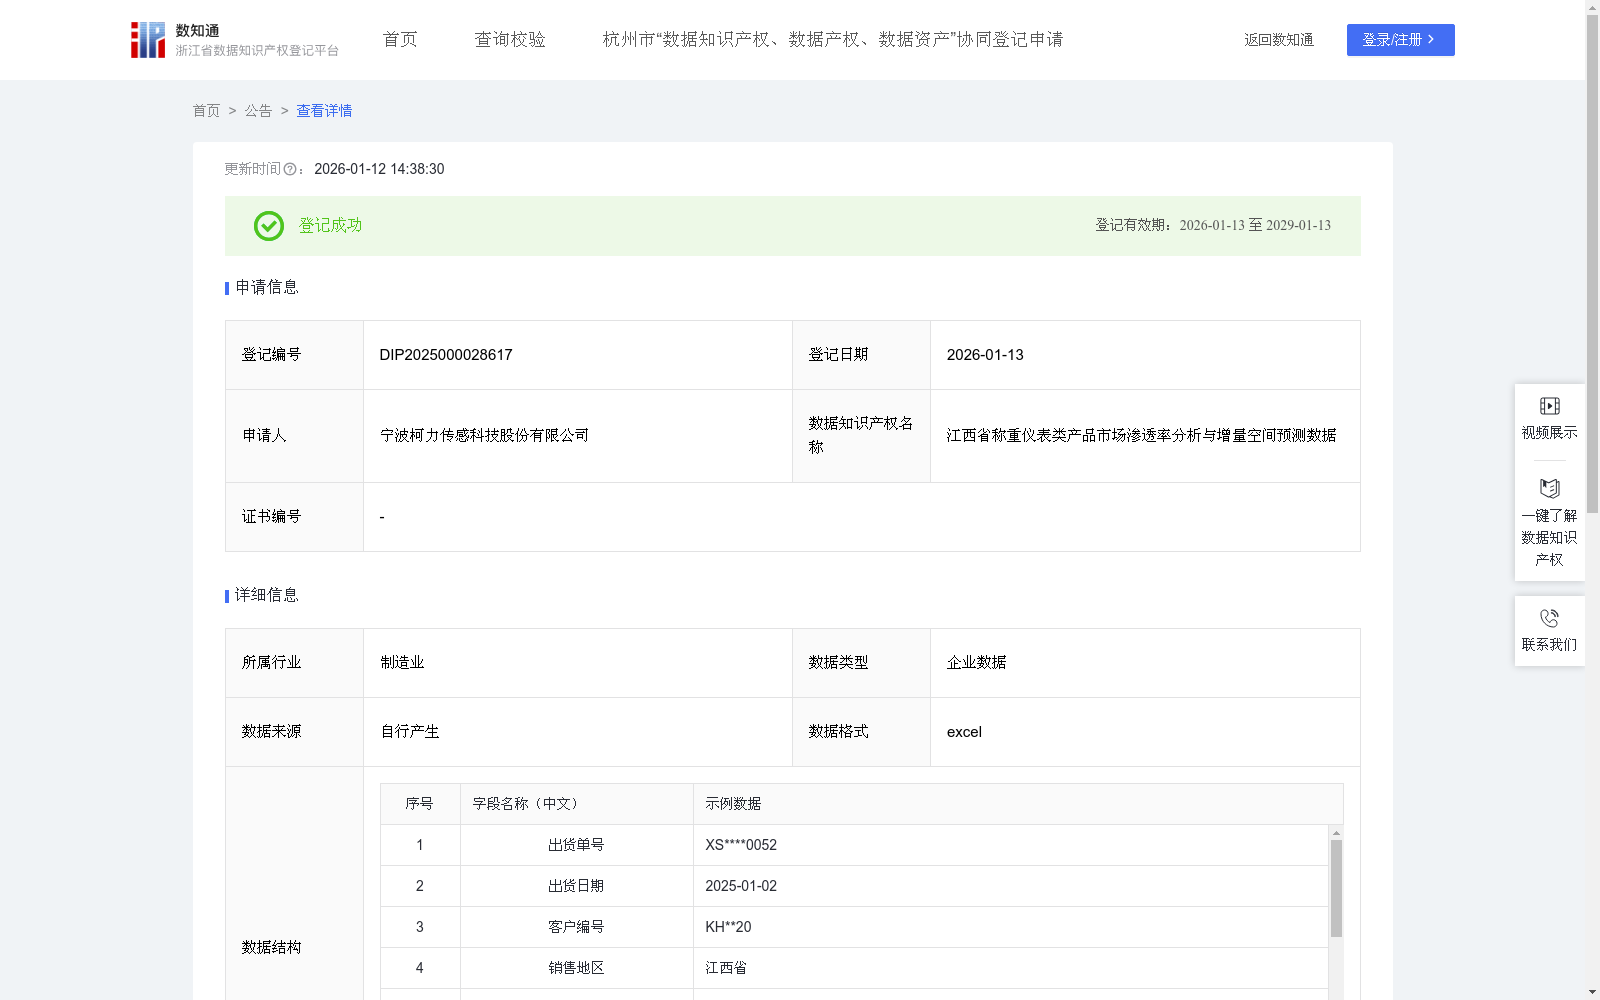
江西省称重仪表类产品市场渗透率分析与增量空间预测数据
收藏资源简介:
市场渗透率是企业评估市场表现和规划发展战略的重要工具。通过对称重仪表类产品在江西省的销售渗透率进行分析,对于评估其在江西地区的市场发展趋势、识别其在江西地区的增长机会和潜在风险提供了重要依据。通过量化各地区市场覆盖水平,识别高、中、低渗透区域,企业能够精准优化策略、提升资源配置效率。对于企业内部,本数据可以指导产品规划与运营管理。企业可依据区域差异调整产品组合。例如,在渗透率高的地区主推高端智能化仪表,在渗透不足区域侧重高性价比型号。销售与库存部门可实现动态管理,避免资源错配。市场预算可精准投向低渗透、高潜力的地区。 对于同行企业,本数据是评估竞争格局与调整自身策略的有效参照。若企业在某区域渗透率显著低于样本均值,往往提示渠道建设或服务能力存在短板,需针对性加强。在渗透饱和地区,则可转向差异化竞争,通过定制化方案或增值服务稳固市场地位,避免同质化竞争造成的资源消耗。 对于产业链上下游企业,渗透率分析有助于提升整体协同效率。上游供应商可依此预测需求、合理规划产能与物流布局;下游渠道商则可优化库存与产品组合,完善售后资源配置。各方通过数据共享加强协作,共同提升产业链的响应速度与整体竞争力。1.数据采集与处理:采集公司系统中一段周期内称重仪表类产品在江西省的销售数据,包括出货单号、出货日期、客户编号、销售地区、产品名、销售数量(件)等关键字段。对相关数据进行脱敏、清洗、聚集、分析。 2.数据计算及运用: 市场渗透率分析模型具体公式规则如下: (1)计算数据统计周期内月均潜在销量(件):数据统计周期内月均潜在销量(件)=数据统计周期内单月最高销量(件)-数据统计周期内单月最低销量(件)+数据统计周期内平均月销量(件);(2)计算数据统计周期内月均市场渗透率:数据统计周期内月均市场渗透率=数据统计周期内平均月销量(件)/数据统计周期内月均潜在销量(件)*100%,保留小数点后两位;(3)市场渗透率分析:0<数据统计周期内月均市场渗透率≤60%,则市场渗透率低,增量空间大;60%<数据统计周期内月均市场渗透率≤90%,则市场渗透率中等,增量空间尚存;数据统计周期内月均市场渗透率>90%,则市场渗透率高,增量空间小。
Market penetration rate is a critical tool for enterprises to evaluate market performance and formulate development strategies. An analysis of the sales penetration of weighing instrument products in Jiangxi Province provides an important basis for assessing local market development trends, identifying growth opportunities and potential risks in the region. By quantifying the market coverage level of each region and classifying them into high-, medium- and low-penetration areas, enterprises can accurately optimize their strategies and improve the efficiency of resource allocation. Internally, this dataset can guide product planning and operational management. Enterprises can adjust their product mix based on regional differences: for example, promoting high-end intelligent instruments in areas with high penetration, and focusing on cost-effective models in areas with insufficient penetration. Sales and inventory departments can implement dynamic management to avoid resource misallocation, and market budgets can be accurately allocated to low-penetration, high-potential regions. For peer enterprises, this dataset serves as an effective reference for evaluating the competitive landscape and adjusting their own strategies. If a company's penetration rate in a certain region is significantly lower than the sample average, it often indicates shortcomings in channel construction or service capabilities, requiring targeted improvements. In regions with saturated penetration, enterprises can shift to differentiated competition, securing their market position through customized solutions or value-added services to avoid resource waste caused by homogeneous competition. For upstream and downstream enterprises in the industrial chain, penetration rate analysis helps improve overall collaborative efficiency. Upstream suppliers can use this data to forecast demand, reasonably plan production capacity and logistics layout; downstream channel merchants can optimize inventory and product mix, and improve after-sales resource allocation. All parties can strengthen collaboration through data sharing, jointly enhancing the industrial chain's response speed and overall competitiveness. 1. Data Collection and Processing: Collect sales data of weighing instrument products in Jiangxi Province within a specified cycle from the company's internal system, including key fields such as shipping order number, shipping date, customer number, sales region, product name, sales quantity (units), etc. Desensitization, cleaning, aggregation and analysis will be performed on the relevant data. 2. Data Calculation and Application: The specific formula rules of the market penetration rate analysis model are as follows: (1) Calculate the average monthly potential sales volume (units) during the data statistics cycle: Average monthly potential sales volume (units) = Highest monthly sales volume (units) in the statistics cycle - Lowest monthly sales volume (units) in the statistics cycle + Average monthly sales volume (units) in the statistics cycle; (2) Calculate the average monthly market penetration rate during the data statistics cycle: Average monthly market penetration rate = (Average monthly sales volume (units) in the statistics cycle / Average monthly potential sales volume (units) in the statistics cycle) * 100%, rounded to two decimal places; (3) Market penetration rate classification and analysis: - If 0 < average monthly market penetration rate ≤ 60%, the market penetration rate is low with large growth space; - If 60% < average monthly market penetration rate ≤ 90%, the market penetration rate is medium with remaining growth space; - If average monthly market penetration rate > 90%, the market penetration rate is high with limited growth space.