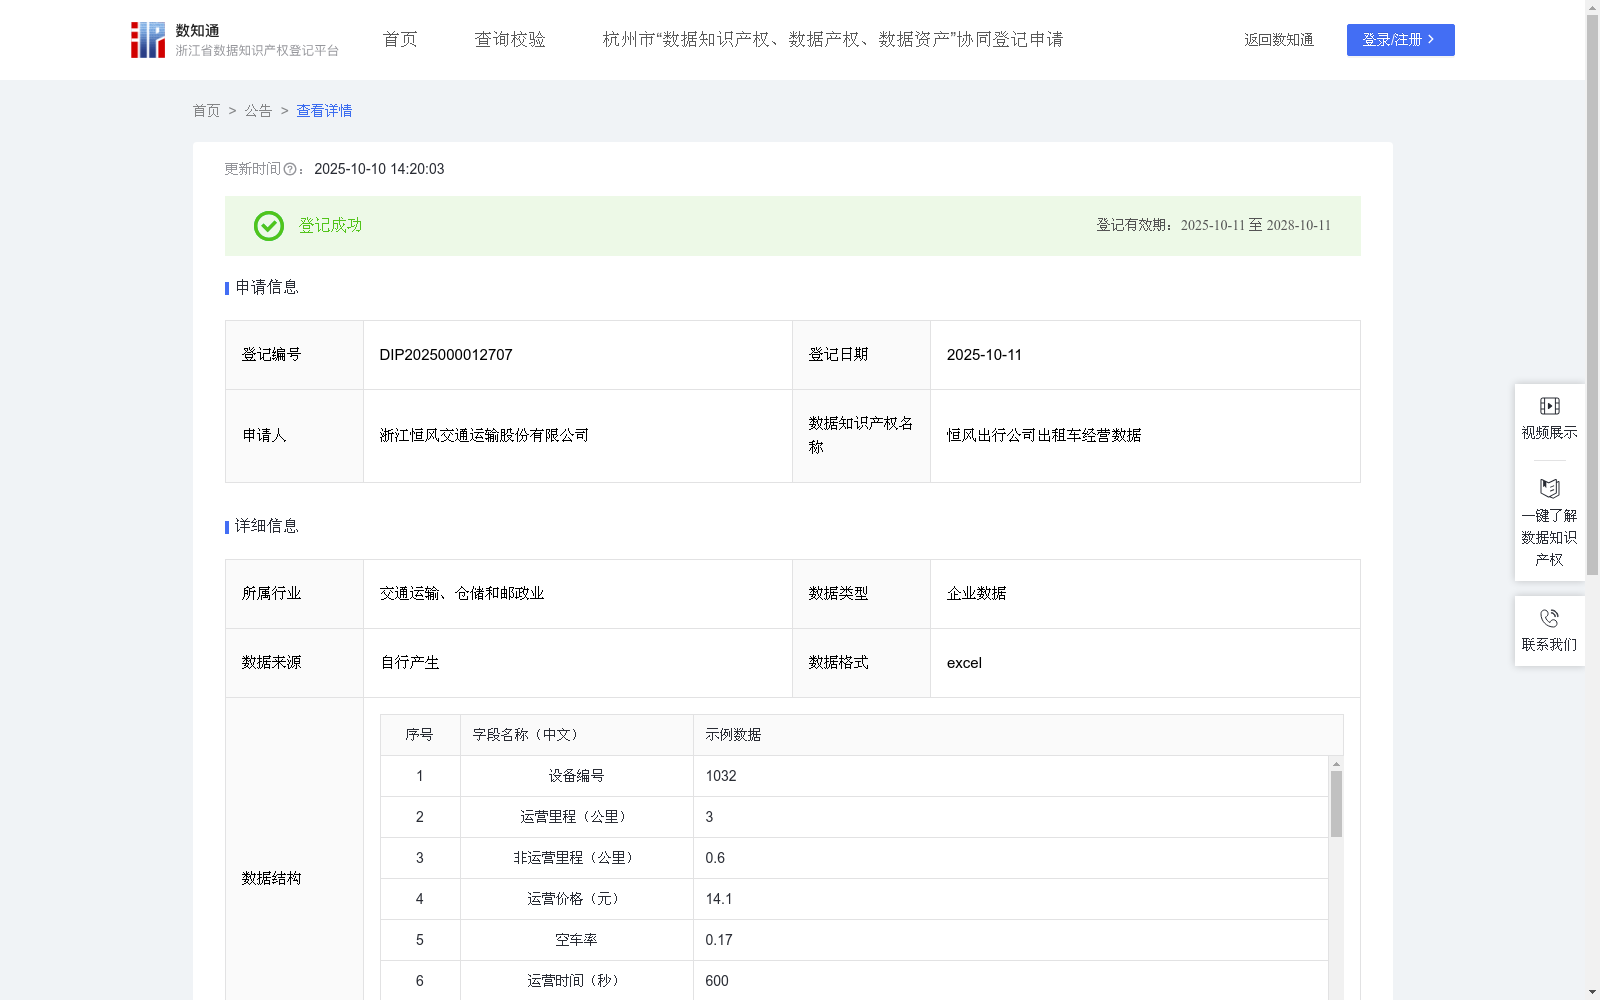
恒风出行公司出租车经营数据
收藏资源简介:
通过收集出租车监控系统上报的实时数据,先对数据进行系统化处理与深度分析,精准核算出每辆出租车的营收明细与行驶里程。在此基础上,重点排查空车率偏高、里程单价异常的车辆,针对其存在的具体问题制定个性化纠错方案,进而持续优化出租车运营服务质量,更精准地满足市民出行需求。除内部运营管理外,还可服务多场景与群体:借助利用上下车经纬度、运营时段分布数据,分析城市热点出行区域和高峰时段,支持政府优化交通信号配时、增设临时停车点,缓解局部拥堵,同时有助于网约车平台动态调整网约车运力调度。商业地产及零售企业利用乘客上下车热点数据,分析商圈、商场的客流来源及出行高峰,优化门店营业时间、促销活动安排。基于历史空车率和运营时段数据,通过平台向乘客推送 “低空车率时段 / 区域” 提示,实现数据从内部管理到社会价值共创的延伸。1.数据整合:将非运营里程与总里程(运营里程+非运营里程)相比,得到每辆出租车的空车率;将运营价格与运营里程相比,获得里程价格比;根据计价器开启时间和计价器结束时间计算每趟运营的时长,命名为服务时间。2.异常值处理:对空车率、里程价格比等关键指标进行统计分析,通过箱线图等方法识别可能的异常值。对于异常高或异常低的值,结合业务逻辑判断是否为数据错误。如果是错误数据,进行修正或剔除;如果是真实的异常情况,单独标记以便后续深入分析。3.数据分组:按车牌号对数据进行分组,计算每组的总营收、总运营里程、平均空车率、平均里程价格比等统计量,以便从车辆层面进行分析,评估出租车在运营时间内的创收效率以及运营活跃度。
Real-time data reported by taxi monitoring systems is collected, followed by systematic processing and in-depth analysis to accurately calculate the revenue breakdown and driving mileage of each individual taxi. On this basis, we focus on identifying taxis with excessively high empty-vehicle rates and abnormal mileage unit prices, formulate personalized correction plans for their specific issues, and thereby continuously improve the quality of taxi operation services to more accurately meet the travel demands of citizens. Beyond internal operation management, this dataset can also serve multiple scenarios and groups: leveraging pickup and drop-off geocoordinates and operation time distribution data, we analyze urban hot travel areas and peak hours, support government authorities in optimizing traffic signal timing and adding temporary parking spots to alleviate local congestion, and also help ride-hailing platforms dynamically adjust their fleet dispatching. Commercial real estate and retail enterprises can use passenger pickup and drop-off hotspot data to analyze passenger flow sources and travel peaks of commercial districts and shopping malls, and optimize store operating hours and promotional event arrangements. Based on historical empty-vehicle rate and operation time data, the platform can push prompts of "low empty-vehicle rate time periods/areas" to passengers, extending the data's value from internal management to co-creation of social value. 1. Data Integration: Non-operating mileage is compared with total mileage (operating mileage + non-operating mileage) to obtain the empty-vehicle rate of each taxi; the operating fare is compared with the operating mileage to obtain the mileage price ratio; the duration of each trip is calculated based on the taximeter start time and taximeter end time, which is defined as service time. 2. Outlier Handling: Statistical analysis is conducted on key indicators such as empty-vehicle rate and mileage price ratio, and potential outliers are identified through methods including box plots. For extremely high or low values, business logic is applied to determine whether they are data errors. If they are erroneous data, they are corrected or removed; if they represent real abnormal situations, they are separately marked for subsequent in-depth analysis. 3. Data Grouping: The dataset is grouped by license plate number, and statistics such as total revenue, total operating mileage, average empty-vehicle rate, and average mileage price ratio are calculated for each group. This enables vehicle-level analysis to evaluate the revenue generation efficiency and operational activity of taxis during their operating hours.