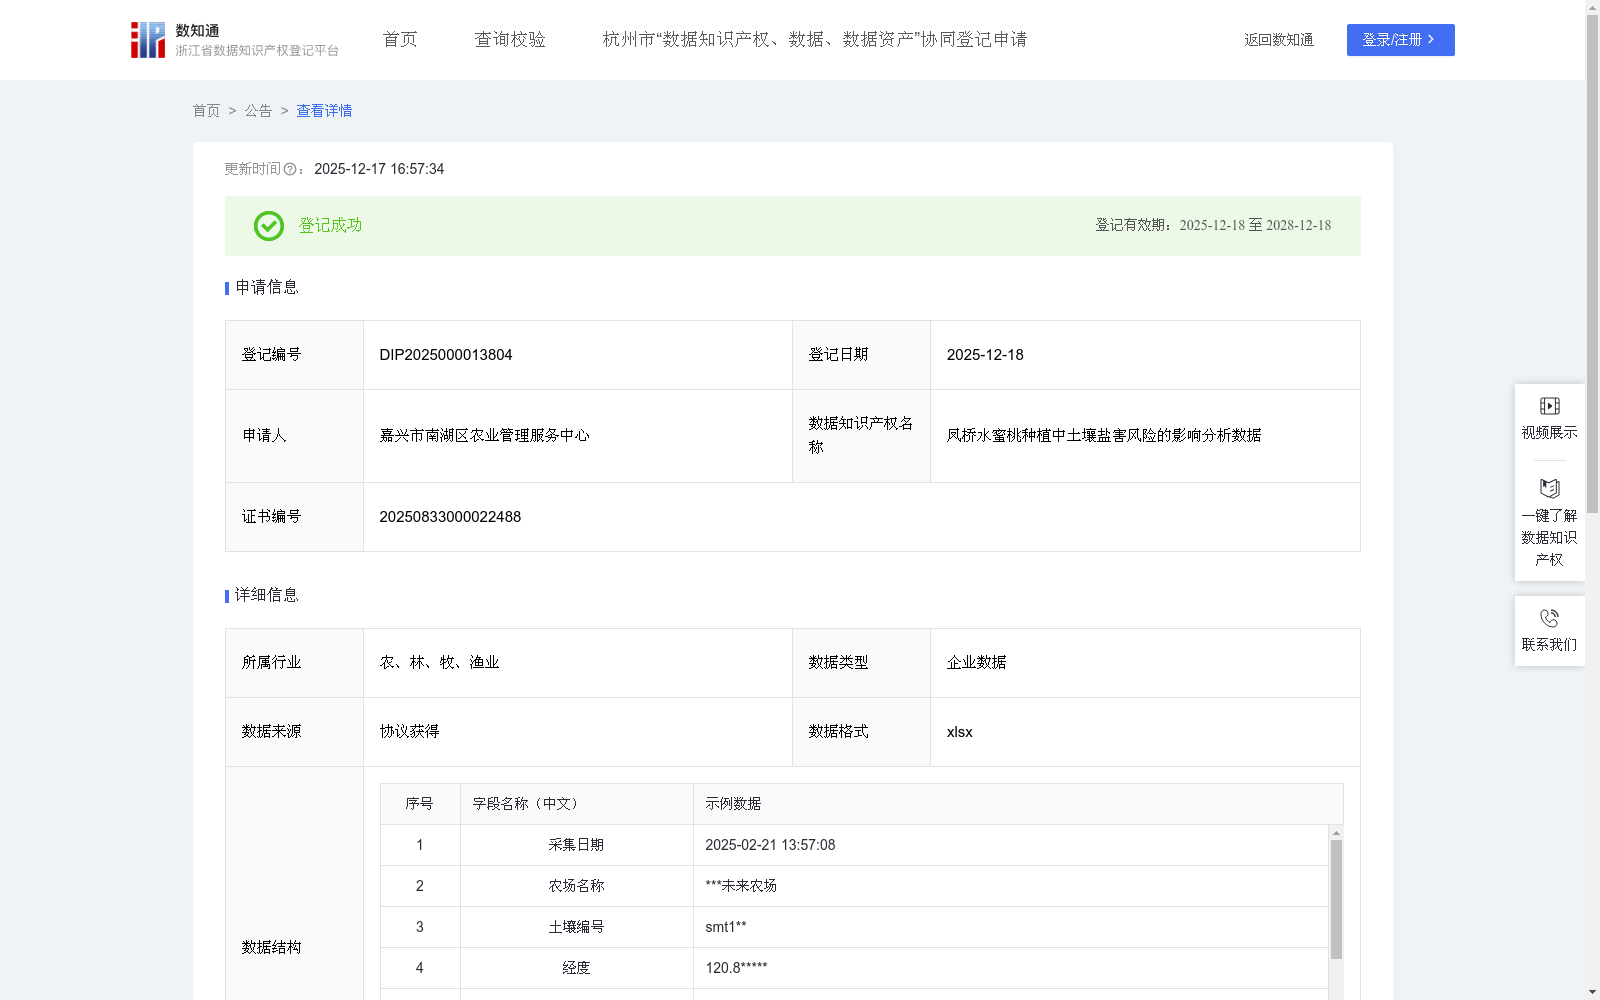
凤桥水蜜桃种植中土壤盐害风险的影响分析数据
收藏资源简介:
本土壤盐害风险指数(SSHI)数据及算法模型,核心服务凤桥水蜜桃精准种植与区域特色农业高质量发展,适配亚热带季风气候区砂壤土 / 壤土、根系层标准化指标采集条件,适用于长三角及气候土壤相似区域的水蜜桃种植,可通过调整指标权重复用于桃类、梨、葡萄等需防控土壤盐害的果树作物。适用对象覆盖种植户、规模化农场、农技推广机构、区域监管部门及农产品供应链企业,兼具实操性与复用价值。数据可实现多层次复用:单次采集数据即时生成风险等级,指导滴灌洗盐、土壤改良等精准干预;时序数据构建长期风险演变模型,支撑轮作规划等长效管理;区域聚合数据形成风险分布图,助力产业布局与基地筛选。模型破解传统盐害判断经验化、滞后性难题,通过量化预警提前干预,减少 10%-20% 减产损失,同时统一地理标志产品品质标准,打通 “数据 - 管控 - 品质” 转化链路,既保障种植效益与产品口碑,又为乡村振兴筑牢产业数据支撑。"一、数据采集:通过调查采集凤桥水蜜桃种植时的电导率、PH值、湿度和温度计算出土壤盐害风险指数。 二、算法规则: 1.计算 EC 基础分: 设定: ①EC≤150 us/cm:基础分 = 0 ②150<EC≤250 us/cm:基础分 =(EC-150)÷W1 ×50(线性递增至 50 分) ③EC>250 us/cm:基础分 = 50 +(EC-250)÷W2 ×50(超过临界值后风险加速上升,350 us/cm 时达 100 分) 2.PH值修正分: PH 修正分 =| 实际 PH-7.0|÷W3 ×10(以 PH=7.0 为基准,PH 每偏离 0.1,修正分增加 1;具体规则: 当 6.0 ≤ PH ≤ 8.0 时:按上述公式计算(PH=6.0 或 PH=8.0 时,修正分=10分)。 当 PH < 6.0 或 PH > 8.0 时:修正分 = 10 分(即 PH≤6.0 或 PH≥8.0 时,修正分上限为10分,偏离越大风险越高,但分值封顶)。 3.湿度修正分: 湿度修正分 =(60 - 实际湿度)÷W4×10(湿度 = 0 时修正分达 10 分,60% 时修正分 = 0) 4.温度修正分: 温度修正分 =(15 - 实际温度)÷W5×10(温度 = 5℃时修正分达 10 分,15℃时修正分 = 0) 5.计算土壤盐害风险指数: 总分(SSHI) = (EC 基础分×60%)+(PH 修正分 ×15%)+(湿度修正分×15%)+ (温度修正分×10%) 三、数据运用: 低风险:SSHI<20 分 中风险:20 分≤SSHI≤40 分 高风险:SSHI>40 分 "
This Soil Salinity Hazard Index (SSHI) dataset and algorithm model are core tools for precise cultivation of Fengqiao peaches and high-quality development of regional characteristic agriculture. They are adapted to the standardized indicator collection conditions of root zones in sandy loam/loam soils of subtropical monsoon climate zones, and are designed for peach cultivation in the Yangtze River Delta and regions with similar climate and soil conditions. They can be reused for fruit tree crops requiring soil salinity hazard prevention and control, such as peaches, pears, and grapes, by adjusting indicator weights. The target users include growers, large-scale farms, agricultural technology extension institutions, regional regulatory authorities, and agricultural product supply chain enterprises, with both practical operability and reusability. The dataset supports multi-level reuse: Single-collected data can instantly generate risk levels to guide precise interventions such as drip irrigation for salt leaching and soil improvement; Time-series data can be used to construct long-term risk evolution models, supporting long-term management such as crop rotation planning; Aggregated regional data can form risk distribution maps, facilitating industrial layout and base selection. The model solves the problems of empirical judgment and lag in traditional salinity hazard assessment, enables early intervention through quantitative early warning, reduces yield loss by 10%-20%, unifies the quality standards for geographical indication products, establishes the "data - control - quality" transformation chain, ensures planting benefits and product reputation, and lays a solid industrial data foundation for rural revitalization. 1. Data Collection The Soil Salinity Hazard Index is calculated by collecting electrical conductivity (EC), pH value, humidity and temperature during Fengqiao peach cultivation through field surveys. 2. Algorithm Rules 1. Calculate EC basic score: Set the rules as follows: ① When EC ≤ 150 μS/cm: Basic score = 0 ② When 150 < EC ≤ 250 μS/cm: Basic score = (EC - 150) ÷ W1 × 50 (linearly increasing to 50 points) ③ When EC > 250 μS/cm: Basic score = 50 + (EC - 250) ÷ W2 × 50 (risk rises rapidly after exceeding the critical value, reaching 100 points at 350 μS/cm) 2. pH correction score: pH correction score = |Actual pH - 7.0| ÷ W3 × 10 (taking pH=7.0 as the baseline, for every 0.1 deviation of pH, the correction score increases by 1; specific rules: When 6.0 ≤ pH ≤ 8.0: Calculate according to the above formula (the correction score is 10 points when pH=6.0 or pH=8.0). When pH < 6.0 or pH > 8.0: Correction score = 10 points (that is, when pH ≤ 6.0 or pH ≥ 8.0, the correction score is capped at 10 points; the greater the deviation, the higher the risk, but the score is capped). 3. Humidity correction score: Humidity correction score = (60 - Actual humidity) ÷ W4 × 10 (the correction score reaches 10 points when humidity = 0, and 0 when humidity = 60%) 4. Temperature correction score: Temperature correction score = (15 - Actual temperature) ÷ W5 × 10 (the correction score reaches 10 points when temperature = 5°C, and 0 when temperature = 15°C) 5. Calculate Soil Salinity Hazard Index: Total score (SSHI) = (EC basic score × 60%) + (pH correction score × 15%) + (Humidity correction score × 15%) + (Temperature correction score × 10%) 3. Data Application Low risk: SSHI < 20 points Medium risk: 20 points ≤ SSHI ≤ 40 points High risk: SSHI > 40 points