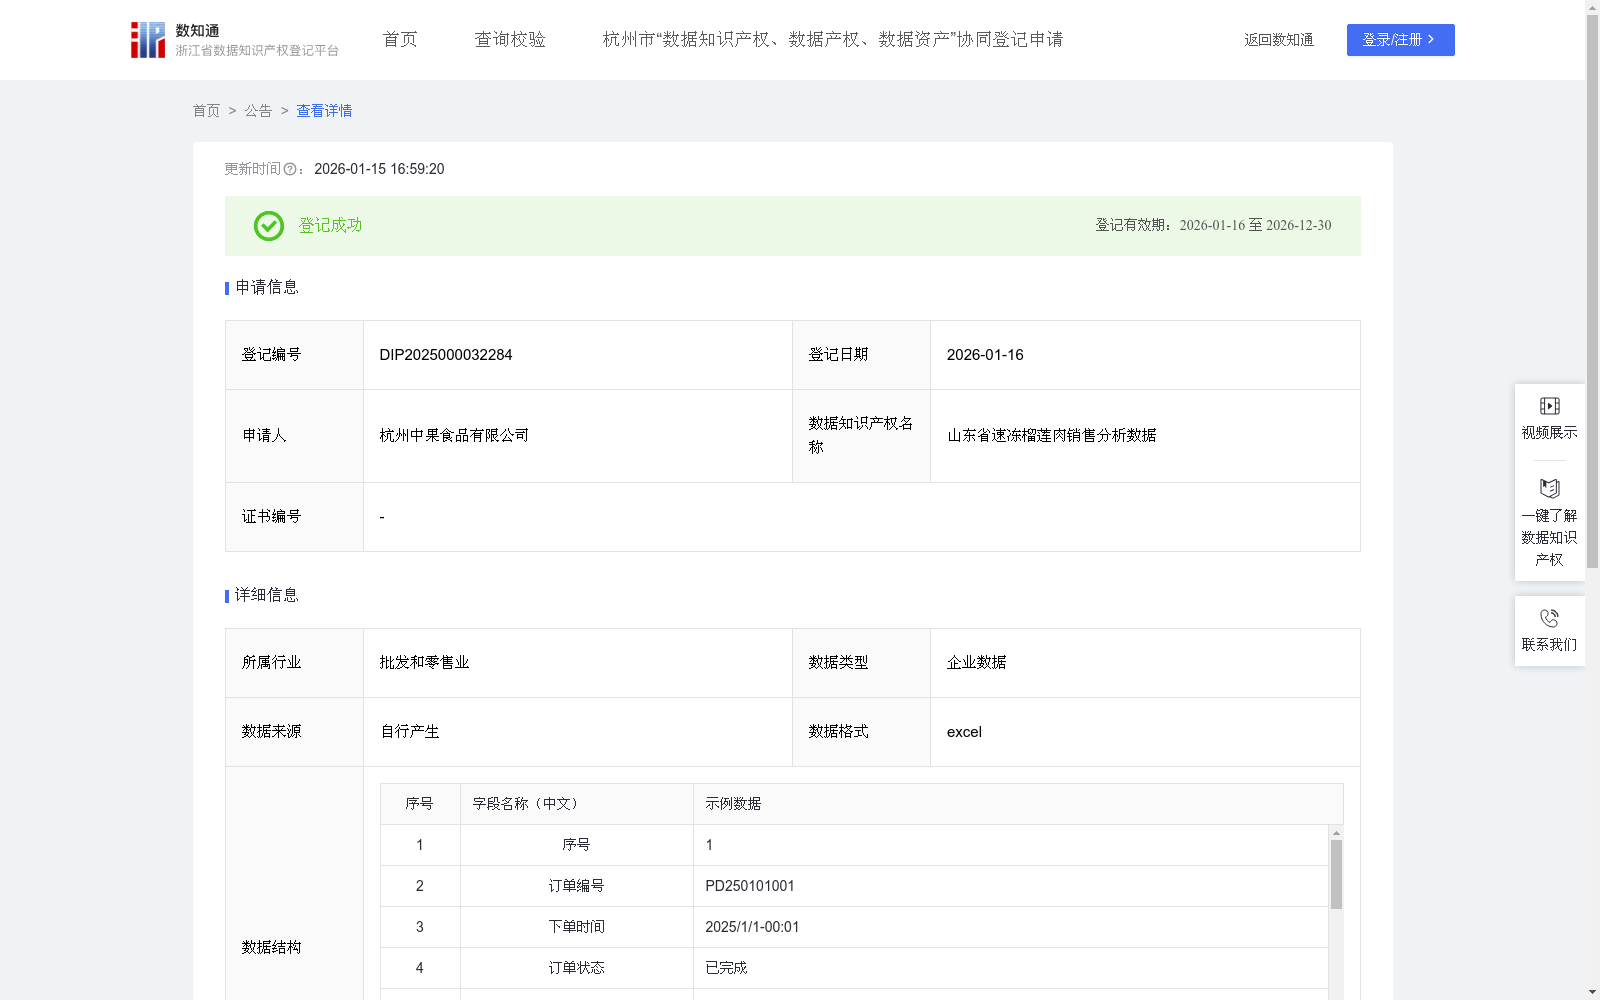
山东省速冻榴莲肉销售分析数据
收藏资源简介:
速冻榴莲肉的销售受地区经济结构,产业组成等条件影响,因此数据收集整理以省份作为划分区间。通过消费者购买速冻榴莲肉的型号重量、消费者的地区、消费者重复购买次数、复购率等,计算出山东省各区域客户需求级别,从而了解各区域市场潜力和消费者购买力情况,为企业相关产品批发、零售行业制定采购、销售策略提供数据支持,实现精准生产与供应链优化和区域针对性供货销售。本数据可帮助本行业所有企业更准确地掌握市场动态及市场需求,同时也为本行业的所有企业制定生产策略提供依据,提升各企业在行业内的销售竞争力。1、数据采集:通过公司内部订单管理系统采集到速冻榴莲肉的销售数据。2、数据处理:对采集到的数据进行脱敏、去错,其中订单编号和消费者id已进行脱敏转换处理。3、数据加工:将处理好的数据按区域累计订单(N)、区域订单总件数(M)、区域当月销售额(E)、区域总重复购买次数(W)、区域复购率(Q)、权重系数ɑ1、权重系数ɑ2、权重系数ɑ3、权重系数ɑ4进行算法加工,区域复购率(Q)= W/M,ɑ1+ɑ2+ɑ3+ɑ4=1,区域供货优先级系数=(M/E)*ɑ1+(M/M)*ɑ2+(E/10000)*ɑ3+Q*ɑ4。4、数据应用:用区域供货优先级系数来设定低、中、高三个等级,<0.6为低优先级,0.6-0.8为中优先级,>0.8高优先级,低优先级减少供货频率,高优先级则增加供货频率。
The sales of frozen durian pulp are affected by regional economic structure, industrial composition and other relevant conditions. Therefore, provinces are taken as the statistical demarcation units for data collection and organization. By collecting indicators including the model and weight of frozen durian pulp purchased by consumers, consumers' regional distribution, the number of repeat purchases per consumer, and repurchase rate, we calculate the customer demand level of each region in Shandong Province, so as to gain insights into the market potential and consumer purchasing power of each region. This provides data support for enterprises in the wholesale and retail sectors of related products to formulate procurement and sales strategies, enabling precise production, supply chain optimization, and targeted regional supply and sales operations. This dataset can assist all enterprises in this industry to accurately grasp market dynamics and demands, provide a basis for formulating production strategies, and enhance the sales competitiveness of enterprises within the industry. 1. Data Collection: Sales data of frozen durian pulp is collected via the company's internal order management system. 2. Data Preprocessing: The collected data is subjected to desensitization and error removal, among which order numbers and consumer IDs have been desensitized and converted. 3. Data Calculation & Processing: The processed data is algorithmically processed based on regional cumulative orders (N), total regional order quantity (M), regional monthly sales (E), total regional repeat purchase times (W), regional repurchase rate (Q), and weight coefficients α₁, α₂, α₃, α₄. The formula for regional repurchase rate is Q = W/M, with α₁+α₂+α₃+α₄=1. The regional supply priority coefficient is calculated as: (M/E)*α₁ + (M/M)*α₂ + (E/10000)*α₃ + Q*α₄. 4. Data Application: The regional supply priority coefficient is used to categorize regions into three levels: low, medium and high priority. Regions with a coefficient less than 0.6 are classified as low priority, those with a coefficient between 0.6 and 0.8 as medium priority, and those with a coefficient greater than 0.8 as high priority. For low priority regions, the supply frequency should be reduced, while for high priority regions, the supply frequency should be increased.