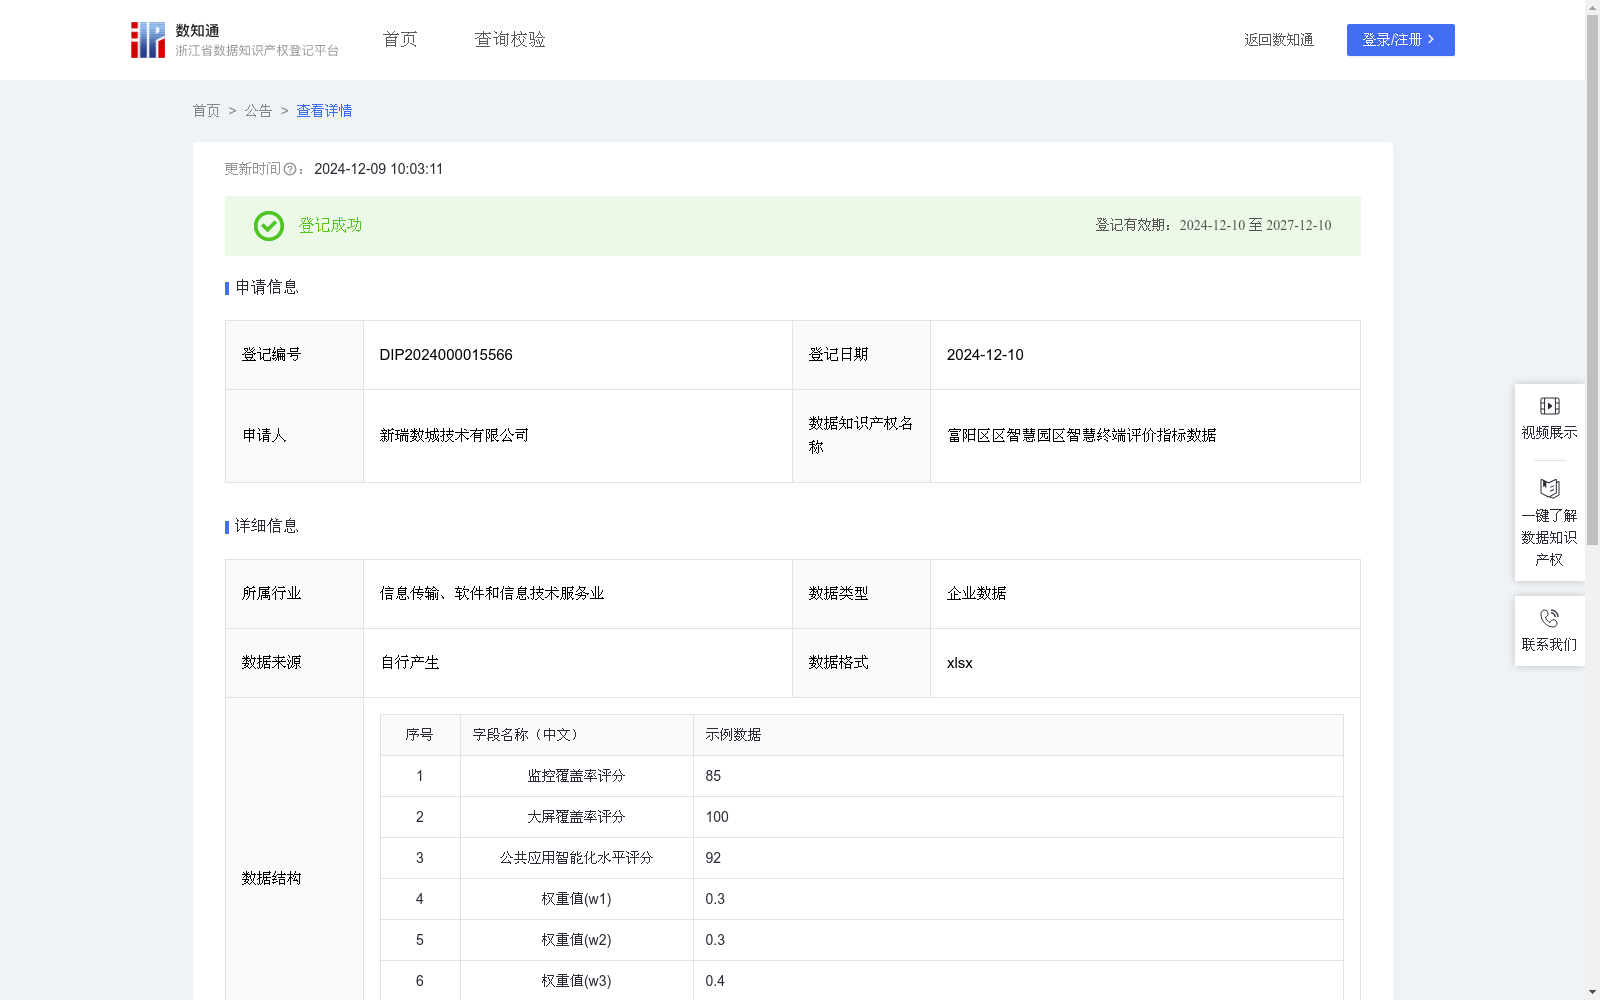
富阳区区智慧园区智慧终端评价指标数据
收藏资源简介:
智慧园区智慧终端指标的应用场景非常广泛,可以帮助管理者和用户更好地理解和应对智慧园区的智慧终端问题。具体应用场景为成本控制: 通过评价体系,园区可以识别成本效益最高的智慧化项目,实现成本控制。一、智慧园区的智慧终端评价可以通过多种方式进行量化和评估。一个常见的做法是建立一个智慧终端评价模型来反映能园区智慧终端的情况。这个指数可以基于多个因素进行计算,包括以下几点: 1、监控覆盖率(Jk):园区内监控覆盖面积占园区总面积的比例,用于衡量园区安全监控系统的覆盖程度,评价分值满分为100 2、大屏覆盖率(Dt):园区入口、公司电梯、交通路口、停车场、办公楼处的大屏覆盖率,评价分值满分为100. 3、公共应用系统智能化水平(Gy):对园区内公共服务平台的建设和应用,如智慧医疗、智慧教育等,评价园区服务的智能化水平进行评价,评价分值满分为100。 4、权重值(W):W1、W2、W3分别是给定的权重,可以根据实际情况调整。 二、我们使用一个简单的公式来计算智慧终端评价指标数据(Zhd),该模型计算公式为:Jk*w1+Dt*w2+Gy*w3 说明:Jk为园区监控覆盖率,Dt为园区的大屏覆盖率,Gy为公共应用系统的智能化水平,W1、W2、W3分别是给定的权重,可以根据实际情况调整。如果认为公共应用系统智能化水平对改评价影响最大,则可以给w3一个较高的值。
The application scenarios of smart terminal indicators for smart parks are extremely extensive, which can help managers and users better understand and address issues related to smart terminals in smart parks. The specific application scenario is cost control: Through the evaluation system, parks can identify the most cost-effective smart projects and achieve cost control. 1. Smart terminal evaluation for smart parks can be quantified and evaluated in multiple ways. A common practice is to establish a smart terminal evaluation model to reflect the status of smart terminals in the park. This index can be calculated based on multiple factors, including the following: 1. Monitoring Coverage (Jk): The proportion of the monitored area within the park to the total park area, used to measure the coverage of the park's security monitoring system, with a full score of 100. 2. Large Screen Coverage (Dt): The coverage rate of large screens installed at park entrances, company elevators, traffic intersections, parking lots, and office buildings, with a full score of 100. 3. Intelligent Level of Public Application Systems (Gy): Evaluate the construction and application of public service platforms within the park (e.g., smart medical care, smart education) to assess the intelligent level of park services, with a full score of 100. 4. Weight Values (W): W1, W2, and W3 are preset weights that can be adjusted based on actual scenarios. 2. We use a simple formula to calculate the smart terminal evaluation indicator data (Zhd). The calculation formula of this model is: Jk*w1 + Dt*w2 + Gy*w3 Note: Jk refers to the park's monitoring coverage, Dt refers to the park's large screen coverage, Gy refers to the intelligent level of public application systems, and W1, W2, and W3 are preset weights that can be adjusted based on actual scenarios. If the intelligent level of public application systems is deemed to have the greatest impact on this evaluation, a higher weight can be assigned to w3.