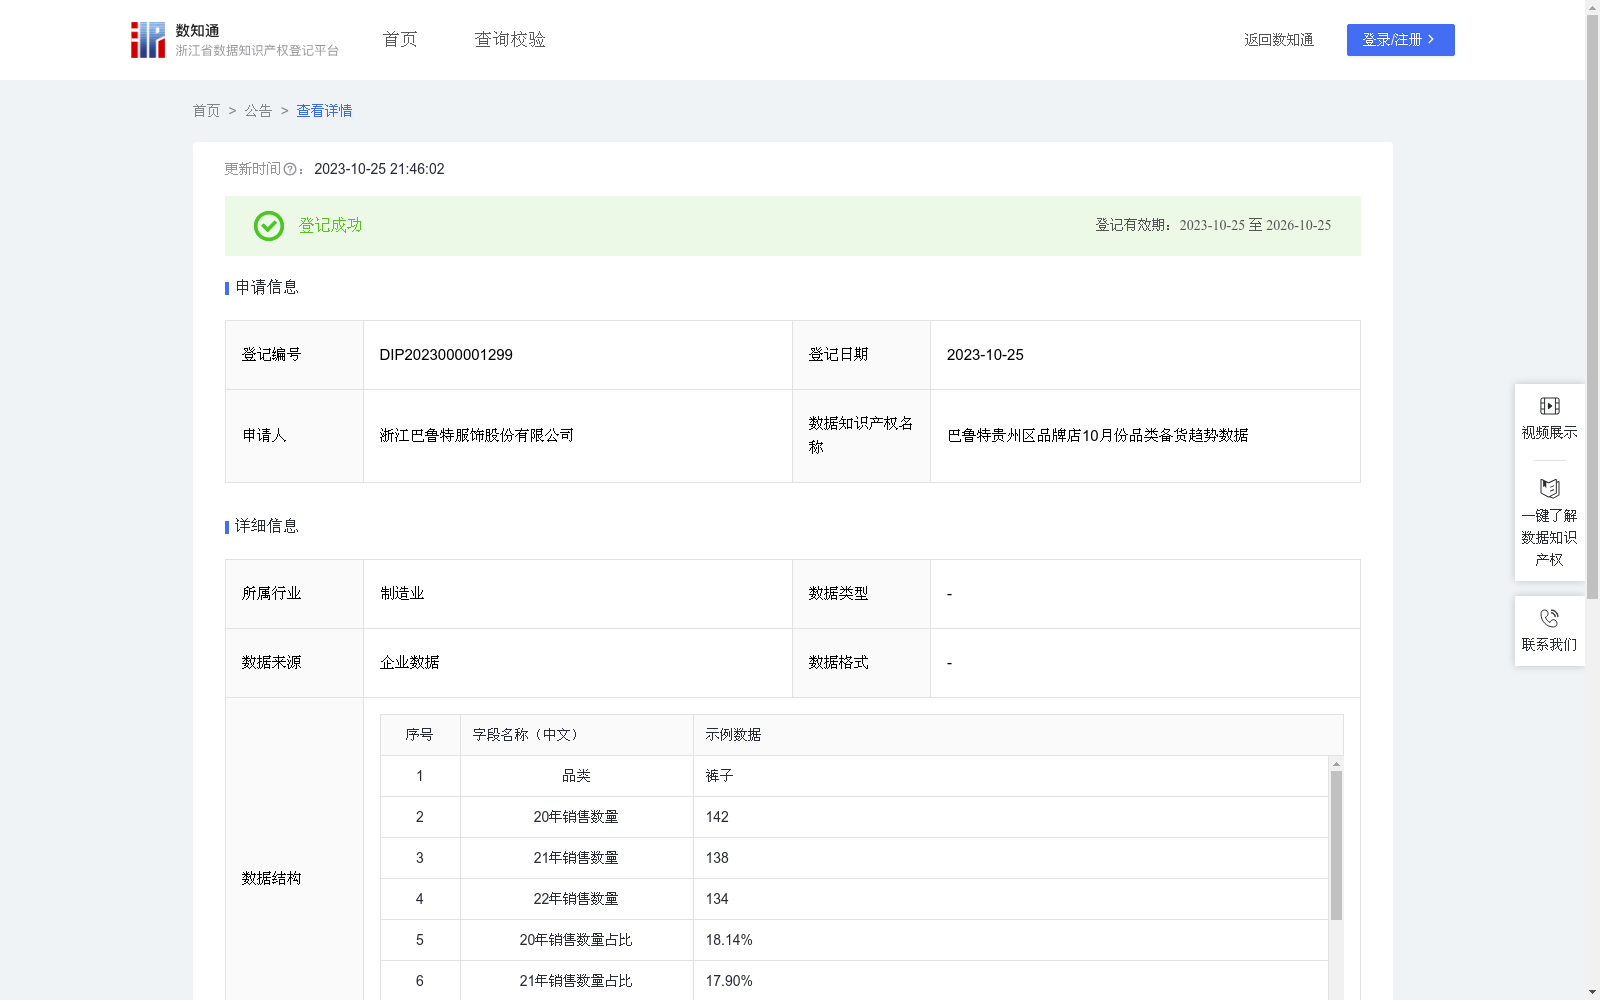
巴鲁特贵州区品牌店10月份品类备货趋势数据
收藏资源简介:
通过贵州区品牌店前三年中每年10月份各品类销售数据分析,预测每年度10月份各品类产品的销售数量,对品牌单品类备货方向做出引导,进而提高品牌各品类的售罄率,提高品牌整体的竞争力。数据来源:通过贵州区品牌店2020-2023年度10月份各品类实际销售占比得出数据,数据处理:20年各品类销售占比为X,21年各品类销售占比为Y,22年各品类销售占比为Z,绝对平均法计算公式为(X+Y+Z)/3:加强平均法,给20/21/22年每年份产品的销售占比计算出一个权重,20年销售占比权重定义为p1,21年销售占比权重定义为p2,22年销售占比权重定义为p3,加强平均法计算公式为X*P1+Y*P2+Z*P3;数据应用:通过以上两种方法的统计和计算得出的结果会更加的精确和有价值;品类备货趋势数据主要用来分析当月品牌哪个品类产品销售趋势会有优势,给品牌备货做出意见指导和建议。
By analyzing the sales data of each product category in October of each of the preceding three years from brand stores in Guizhou region, this dataset is designed to predict the sales volume of each category in October of each subsequent year, guide the stock preparation direction for individual product categories of the brand, and thus improve the sell-through rate of each category and enhance the brand's overall competitiveness. Data Source: The data is sourced from the actual sales proportions of each product category in October across the 2020, 2021, 2022 and 2023 fiscal years from brand stores in Guizhou region. Data Processing: The sales proportion of each category in 2020 is denoted as X, that in 2021 as Y, and that in 2022 as Z. The formula for the simple average method is (X + Y + Z)/3. For the weighted average method, weights are assigned to the sales proportions of each category in 2020, 2021 and 2022, defined as p1, p2 and p3 respectively, with the weighted average formula being X*p1 + Y*p2 + Z*p3. Data Application: The results derived from the statistics and calculations of the two aforementioned methods are more accurate and valuable. The category stock preparation trend data is primarily utilized to analyze which product category will exhibit a dominant sales trend in the current month, providing targeted guidance and recommendations for the brand's stock preparation efforts.