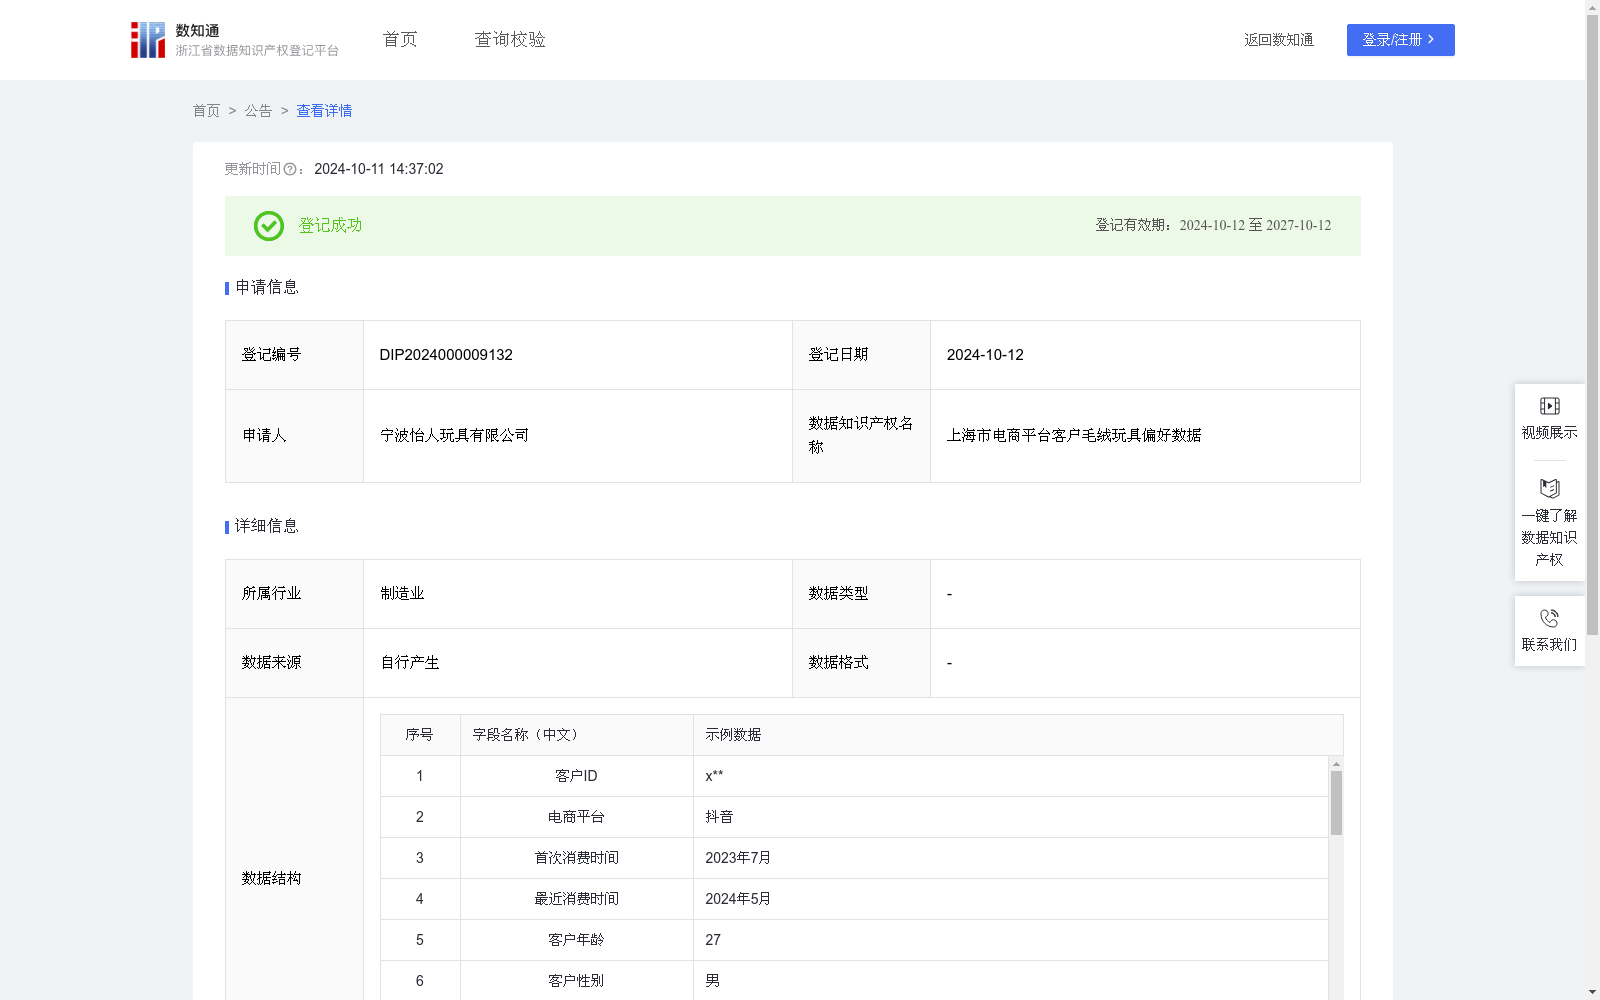
上海市电商平台客户毛绒玩具偏好数据
收藏资源简介:
通过对在京东、天猫、拼多多、抖音等电商平台的上海市客户消费数据进行分析,按玩具类型从浏览、收藏、购买、购买平均价格等多方面进行数据采集,并且采集客户购买时间、年龄、所在城市等数据,根据毛绒玩具偏好数据算法规则,得到毛绒玩具偏好数据。帮助相关公司毛绒玩具实现精准营销、降低销售费用、扩大客源。通过以下算法规则对在京东、天猫、拼多多、抖音等电商平台的浙江省客户进行毛绒玩具偏好指数定义:毛绒玩具偏好指数=(毛绒玩具浏览量占比+毛绒玩具收藏量占比+毛绒玩具购买量占比)*(50+毛绒玩具平均价格)*(100-年龄)*(最近消费时间-首次消费时间,按月份计)*性别系数(男性为1,女性为1.2)*城市系数(一线城市为1.2,二线城市为1.1,三线城市及以下为1)/10000。
By analyzing the consumption data of Shanghai consumers across e-commerce platforms including JD.com, Tmall, Pinduoduo, and Douyin, data was collected from multiple dimensions such as browsing volume, collection count, purchase volume, and average purchase price based on toy types, alongside customer purchase time, age, and city of residence. Following the algorithmic rules for plush toy preference data, plush toy preference datasets were derived. This helps relevant companies implement precise marketing for plush toys, reduce sales expenses, and expand their customer base. For consumers in Zhejiang Province across the aforementioned e-commerce platforms, the plush toy preference index is defined via the following algorithmic rules: Plush Toy Preference Index = [(proportion of plush toy browsing volume + proportion of plush toy collection volume + proportion of plush toy purchase volume) * (50 + average plush toy purchase price) * (100 - age) * (time since last consumption minus first consumption time, calculated in months) * gender coefficient (1 for male, 1.2 for female) * city coefficient (1.2 for first-tier cities, 1.1 for second-tier cities, 1 for third-tier cities and below)] / 10000