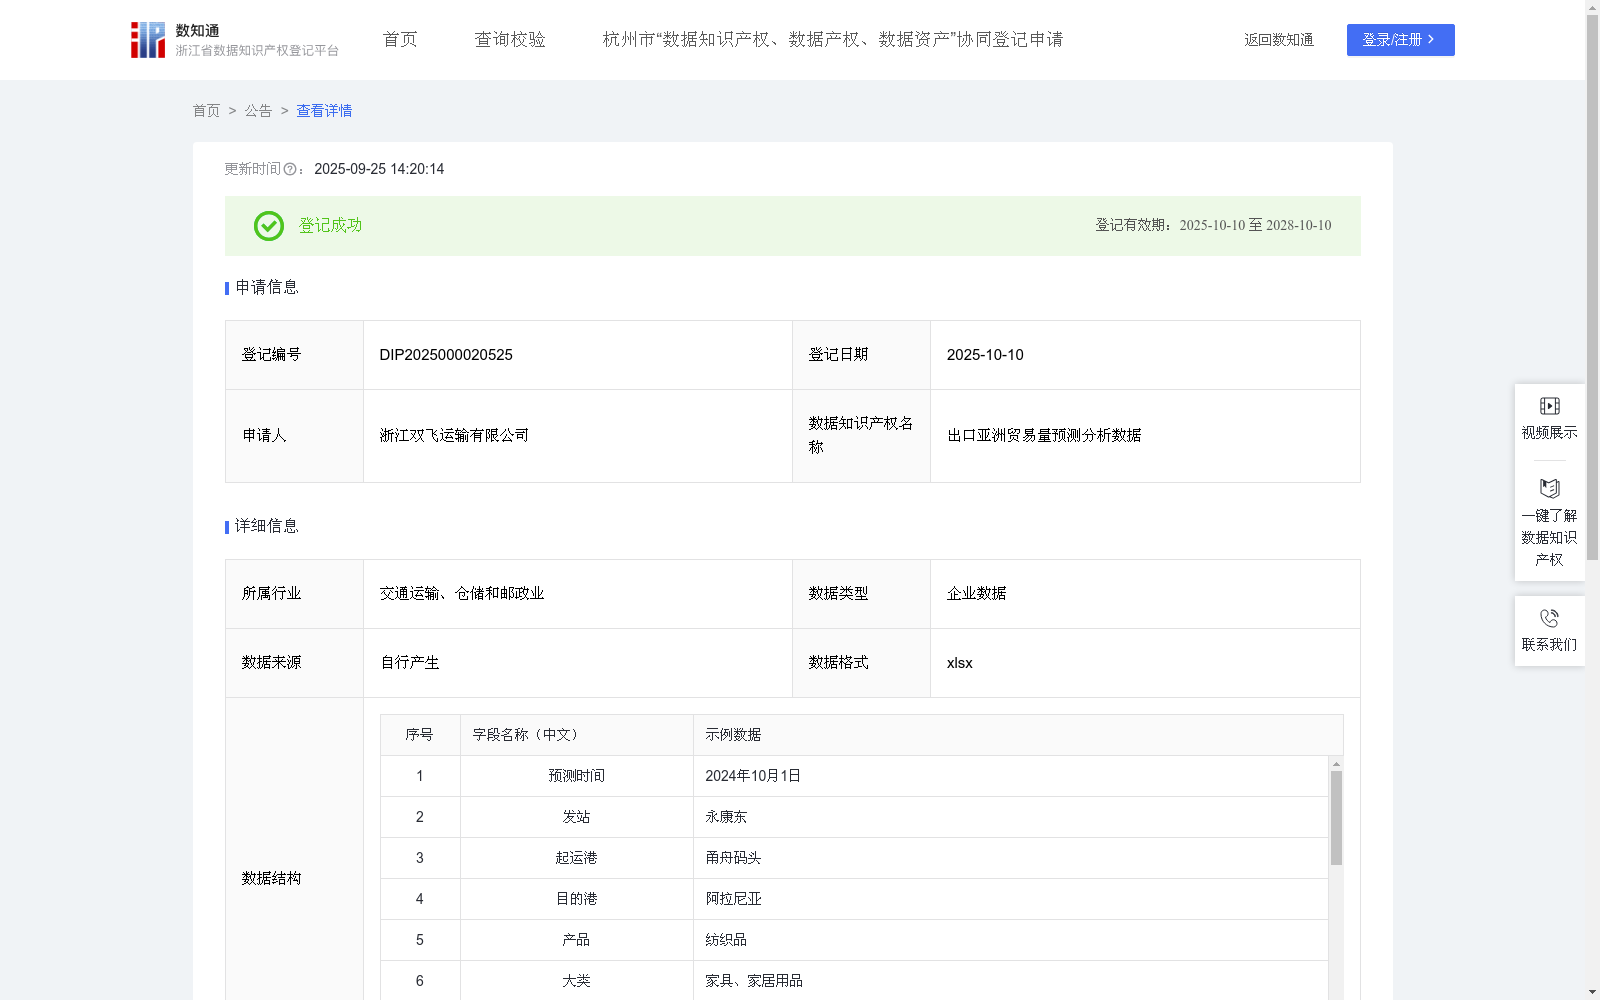
出口亚洲贸易量预测分析数据
收藏资源简介:
本数据聚焦于预测在不同线路运输不同产品货物量的变化。通过“浙江双飞海铁联运数据中心”采集一段时间内不同大类产品以不同线路运输到亚洲的货物量数据,建立运输量预测模型,从而反映不同线路和时间节点的货运趋势。这种分析有助于本企业以及其他国际物流公司提前做出排班计划,合理规划调度货船,提升出口运输效能。此外,预测数据能为相关企业提供市场前置信息,支持其在生产组织和库存管理上做出更合理的安排。1.数据采集:通过“浙江双飞海铁联运数据中心”,采集一段时间内不同大类产品以不同线路运输到亚洲的货物量数据,具体包括:采集发站、大类、起运港、目的港、产品、不同产品每个月出口箱数,并依次用x1, x2...x9表示等数据。“浙江双飞海铁联运数据中心”和本数据集归属于浙江双飞运输有限公司。2.数据预处理:对采集的数据进行清洗,去除重复记录,处理缺失值。 3.数据加工与分析:(1)计算历史运输量:对于每条线路运输的每类产品,使用SUMIFS函数对订单数量进行累加,分别计算出其过去270天、90天和30天的总需求量。(2)建立需求量预测模型:该产品名称的未来30天需求量预测值=[(过去270天总需求量÷270*a)+(过去90天的总需求量÷90*b)+(过去30天的总需求量÷30×c)]*30*k;其中,系数a=0.5,b=0.3,c=0.2,调整因子k=1.1。系数a、b、c反映数值对未来30天需求量预测的影响程度,由于算法更注重长期需求趋势的影响,因此a被赋予了最高的权重。调整因子k基于市场增长预期进行修正。
This dataset focuses on predicting changes in the freight volume of different products transported via various routes. By collecting freight volume data of various product categories transported to Asia via different routes over a given period through the "Zhejiang Shuangfei Sea-Rail Intermodal Data Center", this dataset constructs a freight volume forecasting model to reflect freight trends across different routes and time nodes. This analysis enables this enterprise and other international logistics firms to make advance scheduling plans, rationally arrange and dispatch cargo vessels, and enhance export transportation efficiency. In addition, the forecast data can provide advanced market insights for relevant enterprises, supporting them to formulate more reasonable arrangements for production organization and inventory management. 1. Data Collection: Through the "Zhejiang Shuangfei Sea-Rail Intermodal Data Center", collect freight volume data of various product categories transported to Asia via different routes over a given period, specifically including: departure station, product category, port of shipment, port of destination, product, and monthly export container quantity of each product, which are sequentially labeled as x1, x2...x9 and other relevant data. Both the "Zhejiang Shuangfei Sea-Rail Intermodal Data Center" and this dataset belong to Zhejiang Shuangfei Transportation Co., Ltd. 2. Data Preprocessing: Clean the collected data, remove duplicate records, and handle missing values. 3. Data Processing and Analysis: (1) Calculate historical transportation volume: For each product category transported via a given route, accumulate the order quantities using the SUMIFS function, and calculate the total demand over the past 270 days, 90 days and 30 days respectively. (2) Construct a demand forecasting model: The 30-day future demand forecast value for this product is calculated as: [(Total demand over the past 270 days ÷ 270 × a) + (Total demand over the past 90 days ÷ 90 × b) + (Total demand over the past 30 days ÷ 30 × c)] × 30 × k; where the coefficients a=0.5, b=0.3, c=0.2, and the adjustment factor k=1.1. The coefficients a, b, and c reflect the degree of influence of their respective values on the 30-day future demand forecast. Since the algorithm places greater emphasis on the impact of long-term demand trends, a is assigned the highest weight. The adjustment factor k is revised based on market growth expectations.