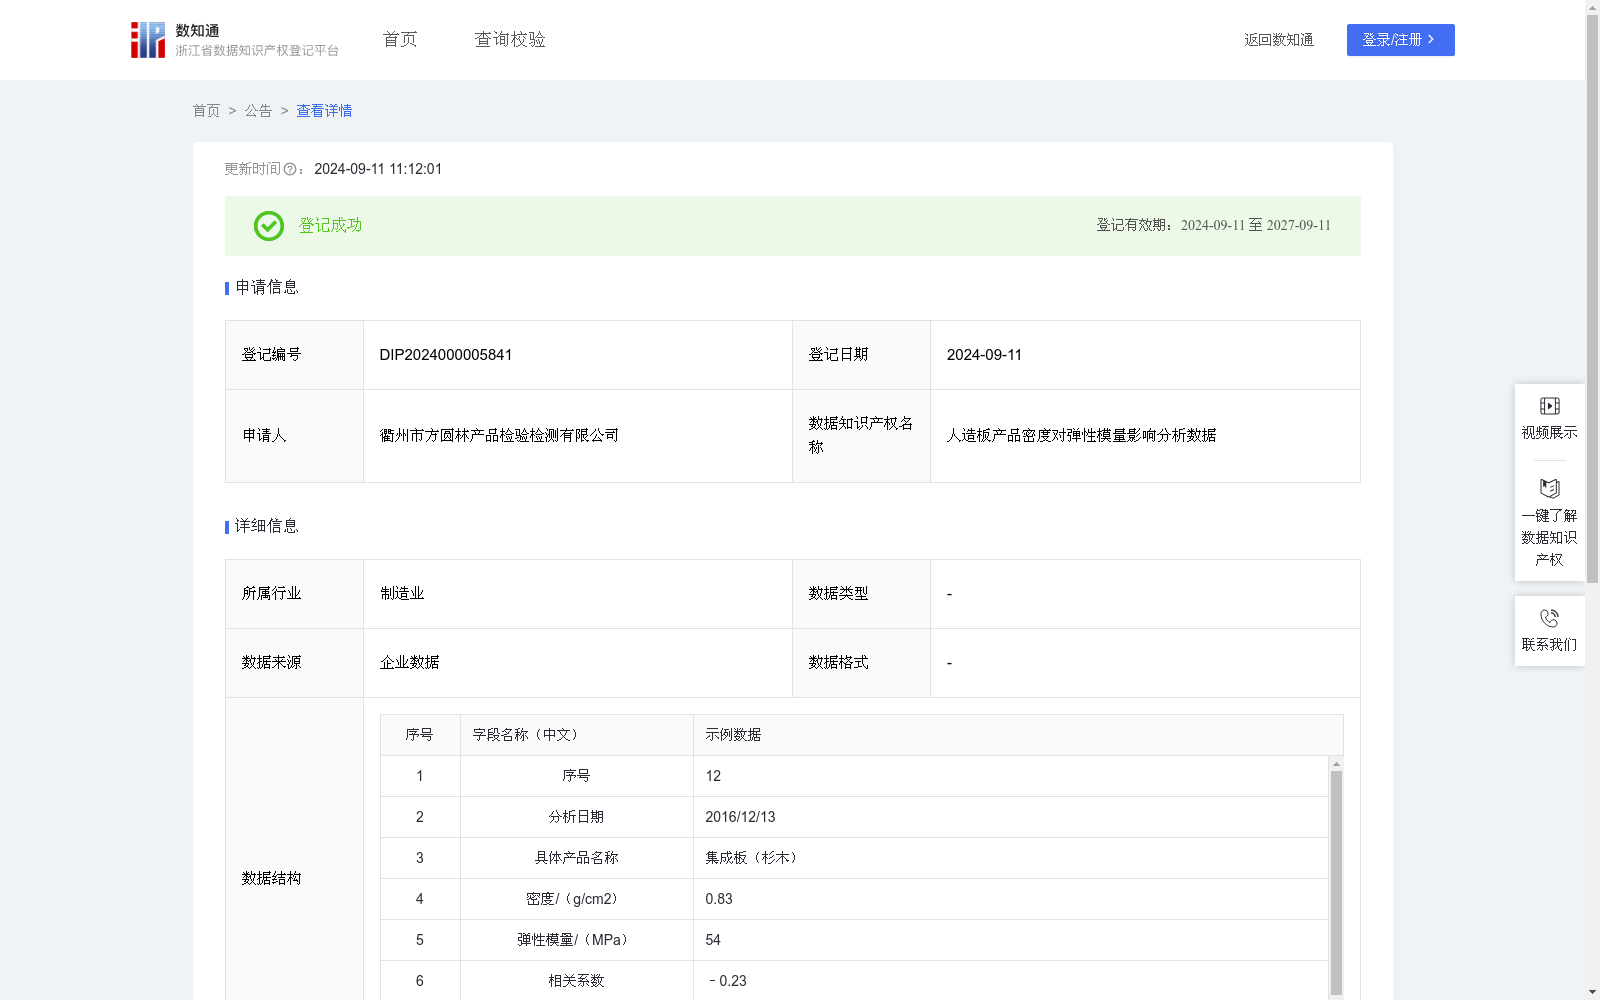
人造板产品密度对弹性模量影响分析数据
收藏资源简介:
相关系数是衡量两个变量之间线性关系强度和方向的统计指标。斜率和截距是线性方程的核心参数,两者共同决定了直线在坐标系中的位置和倾斜程度,有助于数据分析和预测。通过对人造板产品的密度和弹性模量的测试数据的长期积累,并跟踪计算它们之间的相关系数、斜率和截距,具有重要意义。随着数据规模的不断增加,相关系数、斜率和截距的计算值将会越来越准确。本数据可以给人造板领域的相关科研工作者、技术研发人员、质量管理人员、产品检验人员等使用,为他们开展人造板产品密度、弹性模量的预测分析、趋势分析、因果关系探索、质量控制、科学研究、技术优化等工作提供支撑。1、数据采集和预处理: (1)数据采集:采集人造板产品的测试结果数据,包括测试日期、具体产品名称、密度、弹性模量。 (2)数据预处理:对采集的数据进行清洗,去除重复、错误或无关的信息,以便后续的加工和分析。 2、数据加工和分析: (1)计算相关系数:①将历史采集的密度和弹性模量数据以及本次测试的数据汇总形成X、Y两个变量集合;②利用CORREL函数计算出变量集合X、Y之间的相关系数,具体公式为:相关系数=Cov(X,Y)/sX*sY;其中,Cov(X,Y)为X和Y协方差,sX、sY分别为X和Y的标准差; (2)计算斜率和截距:利用LOGEST函数,对变量集合X、Y进行自然对数转换,并在此基础上运用指数回归分析,从而精确地计算出描述变量集合X、Y之间指数关系的斜率和截距。
The correlation coefficient is a statistical metric that quantifies the strength and direction of the linear relationship between two variables. Slope and intercept are core parameters of linear equations; together, they determine the position and inclination of a straight line in a coordinate system, supporting data analysis and prediction. It is of great significance to accumulate long-term test data on the density and elastic modulus of wood-based panel products, and to track and calculate the correlation coefficient, slope and intercept between the two variables. As the scale of the dataset continues to grow, the calculated values of the correlation coefficient, slope and intercept will become increasingly accurate. This dataset can be used by relevant researchers, technical R&D personnel, quality managers, product inspectors and other practitioners in the wood-based panel field, providing support for their work such as predictive analysis, trend analysis, causal relationship exploration, quality control, scientific research and technical optimization of the density and elastic modulus of wood-based panel products. 1. Data Collection and Preprocessing (1) Data Collection: Collect test result data of wood-based panel products, including test date, specific product name, density and elastic modulus. (2) Data Preprocessing: Clean the collected data to remove duplicate, erroneous or irrelevant information for subsequent processing and analysis. 2. Data Processing and Analysis (1) Calculation of Correlation Coefficient: ① Aggregate the historically collected density and elastic modulus data with the current test data to form two variable sets X and Y; ② Use the CORREL function to calculate the correlation coefficient between variable sets X and Y. The specific formula is: Correlation Coefficient = Cov(X,Y)/(s_X * s_Y), where Cov(X,Y) is the covariance of X and Y, and s_X and s_Y are the standard deviations of X and Y respectively. (2) Calculation of Slope and Intercept: Use the LOGEST function to perform natural logarithmic transformation on variable sets X and Y, and conduct exponential regression analysis based on this, thereby accurately calculating the slope and intercept describing the exponential relationship between variable sets X and Y.