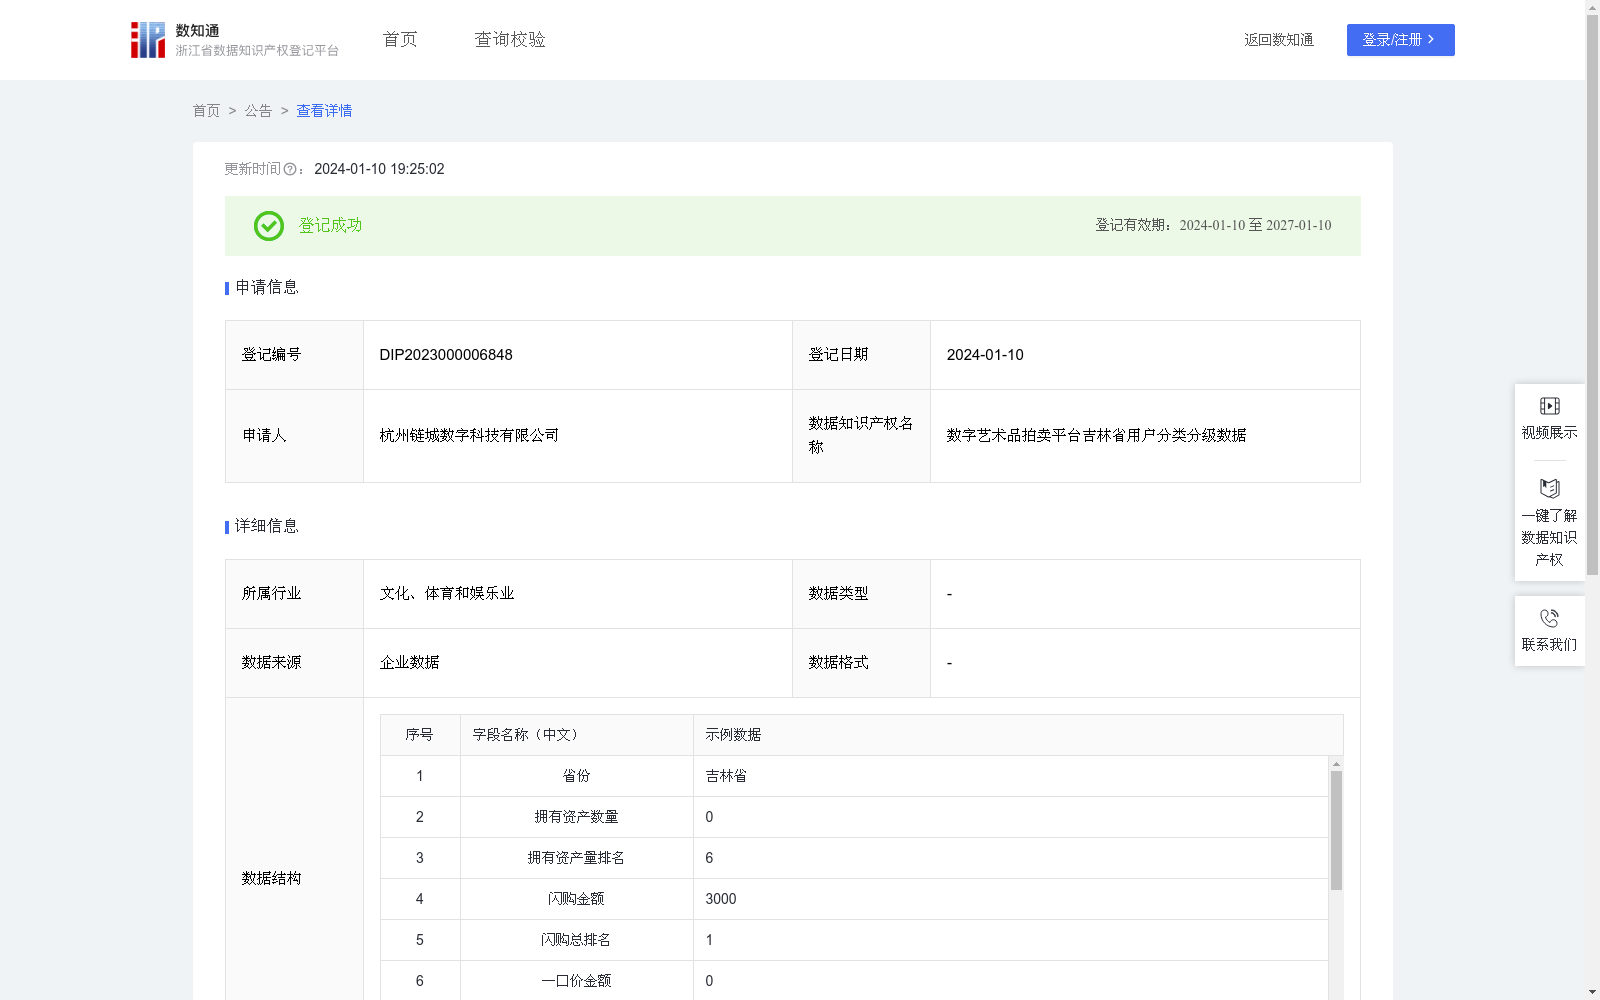
数字艺术品拍卖平台吉林省用户分类分级数据
收藏资源简介:
数字艺术品拍卖平台吉林省用户分类分级数据通过了解用户的资产拥有情况和购买行为,可以构建更完整的用户画像,帮助企业更好地了解目标市场的消费习惯和需求,从而制定更精准的运营策略。此外,通过对比不同交易类型的用户认可度,可以帮助发行方更好地了解市场状况和消费者需求,以便更好地制定数字艺术品的发行策略和销售策略。1.数据采集:采集拍卖平台用户地域、资产情况、拍卖、闪购、一口价、多级流转等数据;2.数据处理:对采集到数据进行去重、合并、累加,便于分析使用;3.算法加工:计算综合得分Y,该得分是根据多个维度的排名计算出来的,包括拥有资产排名、拍卖排名、闪购排名、一口价排名、多级流转排名和总GMV排名,将这些排名值加权平均后得到Y值,这个值可以用来评估用户的综合表现;4.数据分层:根据计算出的Y值进行分类分级,A+: 1-5(含5),A-: 5-10(含10),B: >10,有助于更好地理解用户群体,并针对不同级别的用户采取不同的运营策略,5.数据可视化:制作折线图,展示用户等级的变动情况,帮助决策者直观地看到用户等级的变化趋势,从而制定相应的运营策略。例如,如果A+级别的用户数量在逐渐下降,可能需要采取措施来保持或增加这部分用户的活跃度。
Digital art auction platform's Jilin Province user classification and grading data: By understanding users' asset holdings and purchase behaviors, a more complete user profile can be constructed, helping enterprises better understand the consumption habits and demands of the target market, thereby formulating more precise operation strategies. In addition, by comparing user acceptance of different transaction types, issuers can gain a better understanding of market conditions and consumer demands, so as to better formulate issuance and sales strategies for digital artworks. 1. Data Collection: Collect data including user region, asset holdings, auction, flash sale, fixed-price, multi-level circulation and other relevant data from the auction platform. 2. Data Processing: Deduplicate, merge and accumulate the collected data to facilitate subsequent analysis. 3. Algorithm Processing: Calculate the comprehensive score Y, which is derived from the weighted average of rankings across multiple dimensions, including asset holdings ranking, auction ranking, flash sale ranking, fixed-price ranking, multi-level circulation ranking and total GMV ranking. This score is used to evaluate users' comprehensive performance. 4. Data Stratification: Perform classification and grading based on the calculated Y value, with the grading criteria as follows: A+: 1-5 (inclusive), A-: 5-10 (inclusive), B: >10. This helps to better understand user groups and develop differentiated operation strategies for users at different levels. 5. Data Visualization: Create line charts to display the changes in user levels, enabling decision-makers to intuitively observe the trend of user level changes and formulate corresponding operation strategies. For example, if the number of A+ level users is gradually declining, corresponding measures may need to be taken to maintain or increase the activity of this user group.