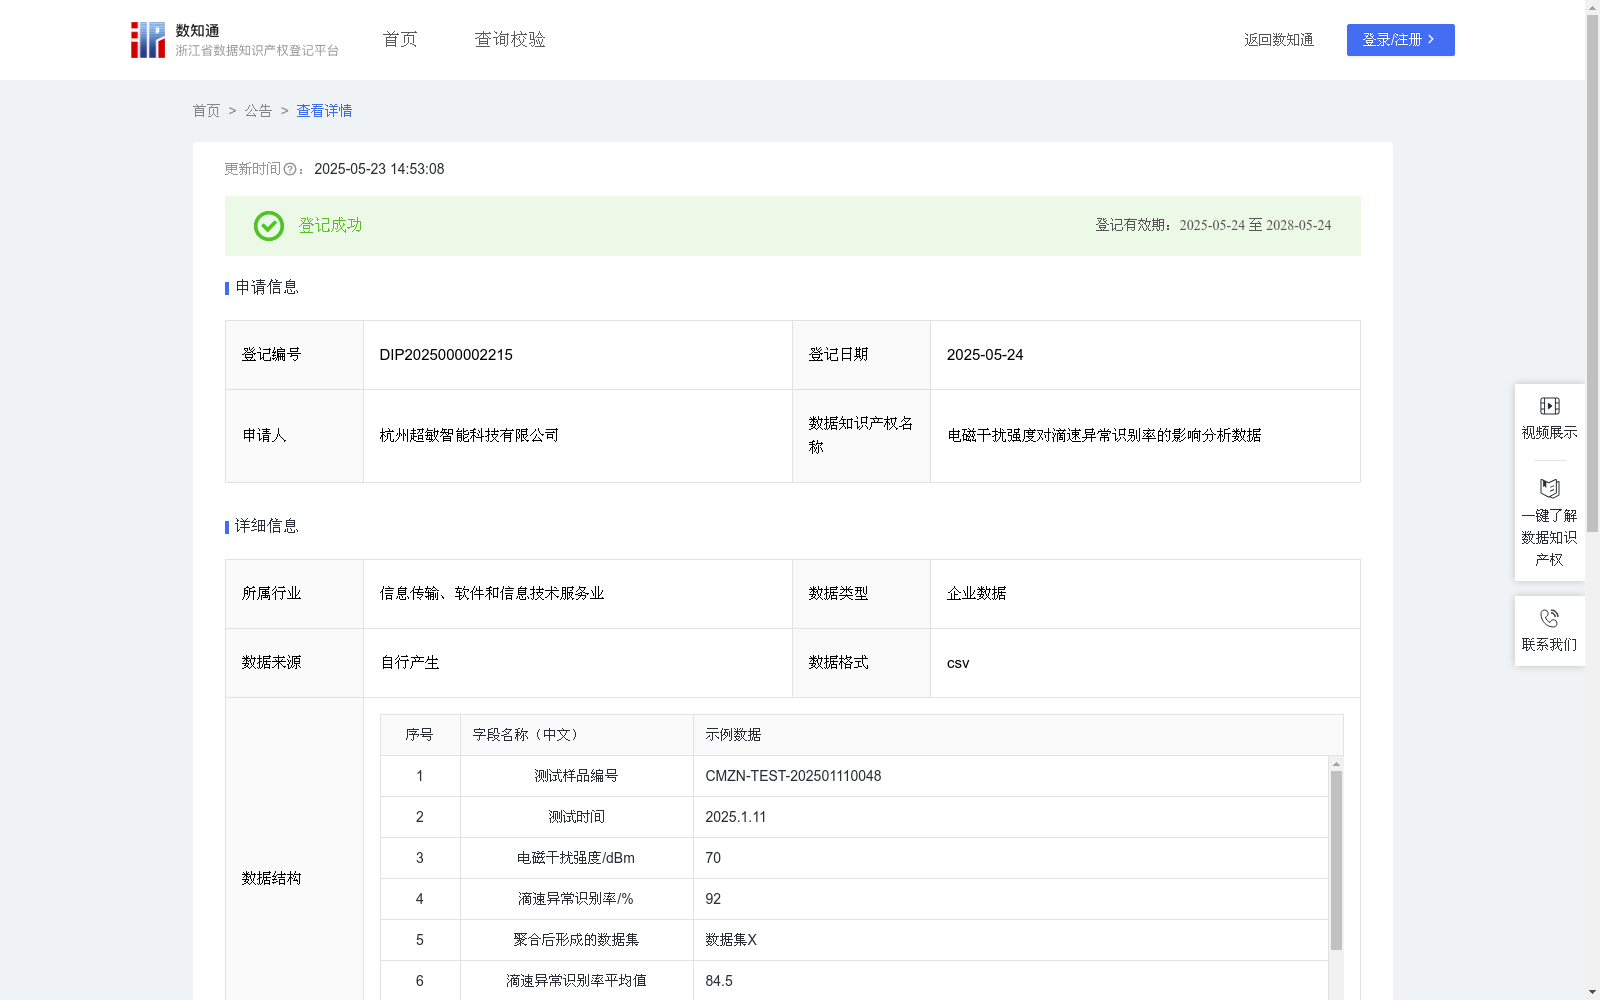
电磁干扰强度对滴速异常识别率的影响分析数据
收藏资源简介:
本数据聚焦于分析电磁干扰强度对滴速异常识别率的影响,明确了电磁干扰强度与滴速异常识别准确性之间的量化关系,为公司及外部相关方提供了重要的决策依据,具有显著的应用价值。具体体现在以下几个方面: 1. 优化监测系统设计:公司依据该数据,能够针对性地调整智能输液监控系统的参数设置或优化滴速异常检测算法,使其更好地适应不同电磁干扰强度下的检测需求。例如,根据电磁干扰强度对滴速异常识别率的影响规律,调整传感器的灵敏度和检测阈值,从而提高滴速异常检测的准确性和稳定性,有效提升滴速异常识别率,减少误报和漏报,提升整个系统的性能和可靠性。 2.保障输液治疗安全性:医疗机构参考这些分析数据,可精准选择适合特定输液环境的智能输液监控设备,确保输液治疗过程中滴速异常的精确检测。例如,在电磁干扰强度较高的环境中,选择能够自动补偿电磁干扰影响的监控设备,减少因电磁干扰强度差异导致的检测偏差,进而降低因滴速异常引发的医疗风险,保障患者治疗的安全性。 3. 完善行业标准制定:监管部门根据该数据,能够更准确地把握电磁干扰强度对智能输液监控系统滴速异常检测的影响规律,从而制定出更具科学性、合理性和针对性的行业标准和规范1.数据采集:实时记录不同电磁干扰强度下的滴速异常识别率测试数据,包括测试样品编号、测试时间、电磁干扰强度/dBm、滴速异常识别率/%等字段。 2.数据预处理:(1)对采集的数据进行去噪处理,确保数据准确性。(2)把历史采集的数据(包含本次采集)进行聚合,形成数据集X,并针对数据集X中的滴速异常识别率字段,计算出其平均值。 3.计算线性回归斜率a和截距b:基于数据集X(以电磁干扰强度为自变量、滴速异常识别率为因变量),运用SLOPE函数,基于最小二乘法原理确定斜率a,运用INTERCEPT函数确定截距b。斜率a表示单位电磁干扰强度变化对滴速异常识别率的影响程度,截距b表示基准电磁干扰强度下滴速异常识别率的值。 4.结果运用:(1)计算比例系数k:k=|a/滴速异常识别率平均值|×100%;(2)若k≥10%,则判定为“高影响”,若5%≤k<10%,则判定为“中影响”,若k<5%,则判定为“低影响”。
This dataset focuses on analyzing the impact of electromagnetic interference (EMI) intensity on drip rate abnormality recognition rate, and clarifies the quantitative relationship between EMI intensity and the accuracy of drip rate abnormality recognition. It provides important decision-making basis for the company and relevant external parties, and has significant application value. The specific manifestations are as follows: 1. Optimization of monitoring system design: The company can adjust the parameter settings of the smart infusion monitoring system or optimize the drip rate abnormality detection algorithm based on this dataset, so as to better adapt to the detection requirements under different EMI intensities. For example, according to the influence law of EMI intensity on drip rate abnormality recognition rate, the sensitivity and detection threshold of the sensor can be adjusted, thereby improving the accuracy and stability of drip rate abnormality detection, effectively increasing the drip rate abnormality recognition rate, reducing false positives and false negatives, and enhancing the performance and reliability of the entire system. 2. Ensuring the safety of infusion therapy: Medical institutions can accurately select smart infusion monitoring equipment suitable for specific infusion environments by referring to this analysis data, ensuring accurate detection of drip rate abnormalities during infusion treatment. For example, in environments with high EMI intensity, select monitoring equipment that can automatically compensate for the impact of EMI, reduce detection deviations caused by differences in EMI intensity, thereby lowering medical risks caused by drip rate abnormalities and ensuring the safety of patient treatment. 3. Improving the formulation of industry standards: Regulatory authorities can more accurately grasp the influence law of EMI intensity on the drip rate abnormality detection of smart infusion monitoring systems based on this dataset, so as to formulate more scientific, reasonable and targeted industry standards and specifications. The dataset construction and analysis process includes the following steps: 1. Data collection: Real-time record the test data of drip rate abnormality recognition rate under different EMI intensities, including fields such as test sample number, test time, electromagnetic interference intensity/dBm, and drip rate abnormality recognition rate/%. 2. Data preprocessing: (1) Denoise the collected data to ensure data accuracy. (2) Aggregate the historically collected data (including this collection) to form dataset X, and calculate the average value of the drip rate abnormality recognition rate field in dataset X. 3. Calculate the linear regression slope a and intercept b: Based on dataset X (with EMI intensity as the independent variable and drip rate abnormality recognition rate as the dependent variable), use the SLOPE function to determine the slope a based on the principle of least squares, and use the INTERCEPT function to determine the intercept b. The slope a represents the degree of influence of unit EMI intensity change on the drip rate abnormality recognition rate, and the intercept b represents the value of the drip rate abnormality recognition rate under the reference EMI intensity. 4. Result application: (1) Calculate the proportional coefficient k: k = |a / average drip rate abnormality recognition rate| × 100%; (2) If k ≥ 10%, it is judged as "high impact"; if 5% ≤ k < 10%, it is judged as "medium impact"; if k < 5%, it is judged as "low impact".