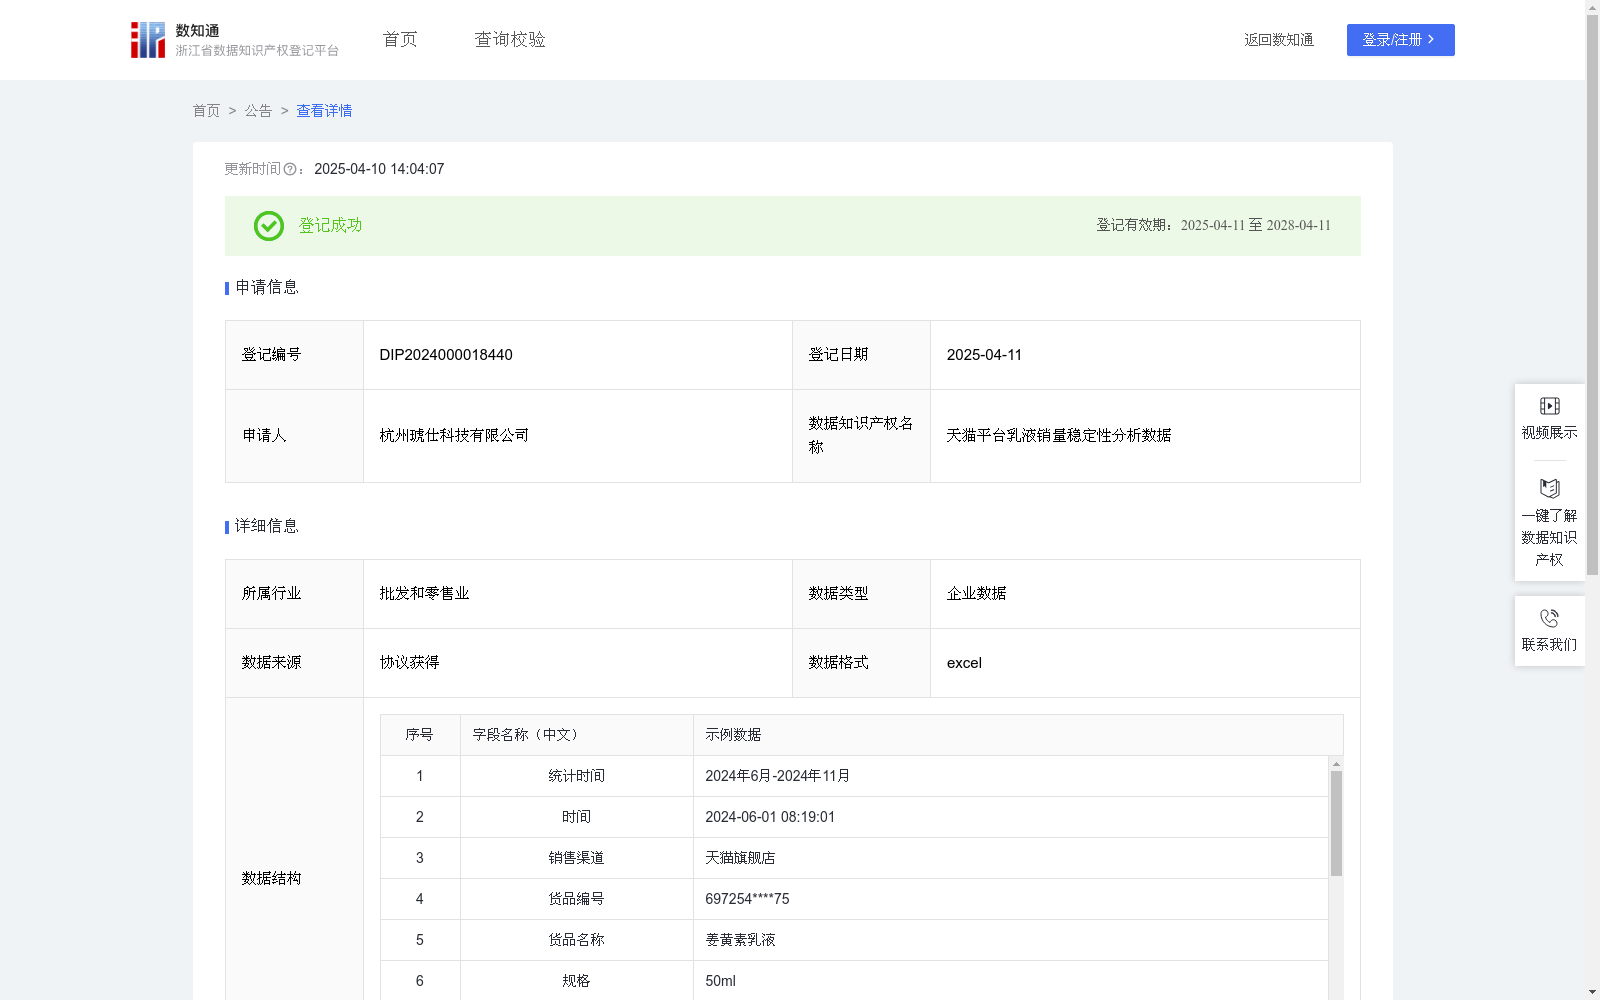
天猫平台乳液销量稳定性分析数据
收藏资源简介:
本数据对公司天猫平台乳液产品的开发改进和精准的库存管理、供应商的生产计划调整、同行销售商的市场策略制定等方面具有重要的应用价值,具体包括:1.利用销量稳定性分析数据,公司能够识别出在市场上表现稳定的乳液,从而在产品开发和改进时做出更符合市场需求的决策。同时,公司还可以据此针对销售稳定的产品进行有效、精准地库存管理。2.对供应商(生产厂家)而言,通过销量稳定性分析有助于了解乳液在天猫平台的销售需求波动风险,从而有针对性地调整生产和供货计划。3.对其他乳液销售商(即同行)而言,本数据可为其了解乳液的市场趋势、明确自身产品定位和市场策略等提供参考。1.数据收集和预处理:(1)数据收集:收集公司近半年在天猫平台乳液的销售统计信息,具体包括统计时间、销售渠道、货品编号、货品名称、规格、数量,6月销量、7月销量、8月销量、9月销量、10月销量、11月销量。(2)数据预处理:对采集到的原始数据进行处理,去除缺失和异常数据。 2.数据汇总:将6至11月的销量汇总,计算得到近半年总销量。 3.建立销量稳定性分析模型:(1)计算月平均销量:计算月平均销量=近半年总销量/6;(2)计算月销量方差:月销售量方差=[(6月销量-月平均销售量)^2+(7月销量-月平均销售量)^2+(8月销量-月平均销售量)^2+…+(11月销量-月平均销售量)^2]/6;(3)销量稳定性分析:当方差小于1000,则分析结论为“销量很平稳”;当方差大于等于1000且小于等于3000,则分析结论为“销量一般平稳”;当方差大于3000,则分析结论为“销量波动大”。
This dataset holds significant application value for the development and improvement of emulsion products on the company's Tmall platform, as well as for precise inventory management, adjustment of suppliers' production plans, and formulation of market strategies by peer retailers. The specific applications are as follows: 1. For the company, by utilizing sales stability analysis data, it can identify emulsions with stable market performance, thereby making more market-demand-aligned decisions during product development and improvement. Meanwhile, the company can also conduct effective and precise inventory management for products with stable sales based on this data. 2. For suppliers (manufacturers), sales stability analysis helps them understand the fluctuation risks of sales demand for emulsions on the Tmall platform, so as to adjust their production and supply plans in a targeted manner. 3. For other emulsion retailers (i.e., peers), this dataset can provide references for them to understand market trends of emulsions, clarify their own product positioning and market strategies, etc. 1. Data Collection and Preprocessing: (1) Data Collection: Collect the sales statistics of the company's emulsions on the Tmall platform over the past six months, specifically including statistical time, sales channel, product ID, product name, specification, sales quantity, sales volume in June, July, August, September, October, and November. (2) Data Preprocessing: Process the collected raw data by removing missing and abnormal data. 2. Data Aggregation: Aggregate the sales volumes from June to November to calculate the total sales volume over the past six months. 3. Establishment of Sales Stability Analysis Model: (1) Calculate Monthly Average Sales Volume: Monthly average sales volume = Total sales volume over the past six months / 6; (2) Calculate Monthly Sales Variance: Monthly sales variance = [(Sales volume in June - Monthly average sales volume)² + (Sales volume in July - Monthly average sales volume)² + (Sales volume in August - Monthly average sales volume)² + … + (Sales volume in November - Monthly average sales volume)²] / 6; (3) Sales Stability Analysis: When the variance is less than 1000, the analysis conclusion is "sales volume is very stable"; when the variance is greater than or equal to 1000 and less than or equal to 3000, the analysis conclusion is "sales volume is generally stable"; when the variance is greater than 3000, the analysis conclusion is "sales volume has large fluctuations".